## Chart: PESQ Scores vs. Theta
### Overview
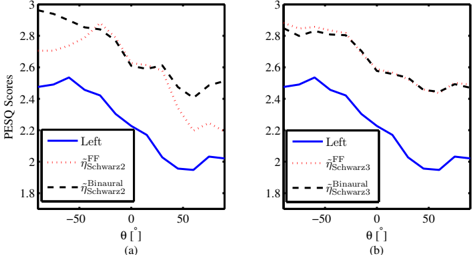
The image contains two line charts, (a) and (b), displaying PESQ (Perceptual Evaluation of Speech Quality) scores as a function of theta (θ) in degrees. Each chart compares three different conditions: "Left," "-FF ηSchwarz2" (or "ηSchwarz3" in chart (b)), and "-Binaural ηSchwarz2" (or "ηSchwarz3" in chart (b)). The x-axis represents theta (θ) ranging from approximately -60 to +60 degrees, and the y-axis represents PESQ scores ranging from 1.8 to 3.0.
### Components/Axes
* **X-axis (Horizontal):** Theta (θ) in degrees. Markers are present at approximately -50, 0, and 50 degrees.
* **Y-axis (Vertical):** PESQ Scores. Markers are present at 1.8, 2.0, 2.2, 2.4, 2.6, 2.8, and 3.0.
* **Chart (a) Legend (Left Side):**
* **Blue Solid Line:** Left
* **Red Dotted Line:** -FF ηSchwarz2
* **Black Dashed Line:** -Binaural ηSchwarz2
* **Chart (b) Legend (Right Side):**
* **Blue Solid Line:** Left
* **Red Dotted Line:** -FF ηSchwarz3
* **Black Dashed Line:** -Binaural ηSchwarz3
### Detailed Analysis
**Chart (a):**
* **Left (Blue Solid Line):** Starts at approximately 2.5 at -60 degrees, increases slightly to about 2.55 near -40 degrees, then decreases to approximately 1.95 at +60 degrees.
* (-60, 2.5)
* (-40, 2.55)
* (0, 2.4)
* (40, 2.0)
* (60, 1.95)
* **-FF ηSchwarz2 (Red Dotted Line):** Starts at approximately 2.7 at -60 degrees, increases to about 2.85 near -40 degrees, then decreases to approximately 2.4 at +60 degrees.
* (-60, 2.7)
* (-40, 2.85)
* (0, 2.8)
* (40, 2.5)
* (60, 2.4)
* **-Binaural ηSchwarz2 (Black Dashed Line):** Starts at approximately 2.9 at -60 degrees, decreases to about 2.45 at +60 degrees.
* (-60, 2.9)
* (-40, 2.85)
* (0, 2.6)
* (40, 2.5)
* (60, 2.45)
**Chart (b):**
* **Left (Blue Solid Line):** Starts at approximately 2.5 at -60 degrees, increases slightly to about 2.55 near -40 degrees, then decreases to approximately 1.95 at +60 degrees.
* (-60, 2.5)
* (-40, 2.55)
* (0, 2.3)
* (40, 2.0)
* (60, 1.95)
* **-FF ηSchwarz3 (Red Dotted Line):** Starts at approximately 2.8 at -60 degrees, increases to about 2.85 near -40 degrees, then decreases to approximately 2.5 at +60 degrees.
* (-60, 2.8)
* (-40, 2.85)
* (0, 2.7)
* (40, 2.5)
* (60, 2.5)
* **-Binaural ηSchwarz3 (Black Dashed Line):** Starts at approximately 2.85 at -60 degrees, decreases to about 2.5 at +60 degrees.
* (-60, 2.85)
* (-40, 2.8)
* (0, 2.6)
* (40, 2.5)
* (60, 2.5)
### Key Observations
* In both charts, the "Left" condition consistently has the lowest PESQ scores, especially at higher theta values.
* The "-Binaural" condition generally has the highest PESQ scores across all theta values in both charts.
* The "-FF" condition's PESQ scores are generally between the "Left" and "-Binaural" conditions.
* The PESQ scores for all conditions tend to decrease as theta increases from negative to positive values.
* The difference between ηSchwarz2 and ηSchwarz3 appears to have a minor impact on the overall trends.
### Interpretation
The charts suggest that binaural processing (represented by the "-Binaural" condition) improves speech quality compared to the "Left" condition alone. The "-FF" condition, which likely represents some form of feed-forward processing, also improves speech quality compared to the "Left" condition, but not as much as the "-Binaural" condition. The decrease in PESQ scores as theta increases may indicate that speech quality degrades as the sound source moves further to the right. The similarity between the results for ηSchwarz2 and ηSchwarz3 suggests that the specific parameter being varied has a relatively small impact on the overall speech quality.