\n
## Chart: PESQ Scores vs. Angle
### Overview
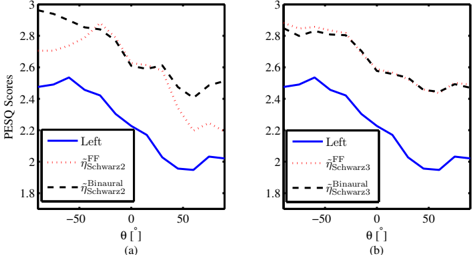
The image presents two line graphs (labeled (a) and (b)) displaying PESQ scores as a function of angle θ (in degrees). Each graph compares the PESQ scores for "FF ηSchwarz2" and "Binaural ηSchwarz2" (in graph (a)) and "FF ηSchwarz3" and "Binaural ηSchwarz3" (in graph (b)). The graphs appear to be evaluating the perceptual quality of audio signals under different spatial conditions.
### Components/Axes
* **X-axis:** θ [°] (Angle in degrees), ranging from approximately -60 to +60.
* **Y-axis:** PESQ Scores, ranging from approximately 1.8 to 3.0.
* **Legend (Graph a):**
* Blue Solid Line: Left - FF ηSchwarz2
* Black Dashed Line: Binaural ηSchwarz2
* **Legend (Graph b):**
* Red Dotted Line: FF ηSchwarz3
* Black Dashed Line: Binaural ηSchwarz3
* **Labels:** (a) and (b) identify the two separate graphs.
### Detailed Analysis or Content Details
**Graph (a):**
* **FF ηSchwarz2 (Blue Solid Line):** The line generally slopes downward from approximately -60° to 0°, reaching a minimum around 0° (approximately 2.1 PESQ score). It then increases slightly from 0° to +60°.
* At -60°: PESQ ≈ 2.55
* At -30°: PESQ ≈ 2.45
* At 0°: PESQ ≈ 2.1
* At +30°: PESQ ≈ 2.15
* At +60°: PESQ ≈ 2.2
* **Binaural ηSchwarz2 (Black Dashed Line):** This line exhibits a more pronounced peak around -30° (approximately 2.8 PESQ score) and a trough around 0° (approximately 1.9 PESQ score). It generally decreases from -60° to 0° and increases from 0° to +60°.
* At -60°: PESQ ≈ 2.7
* At -30°: PESQ ≈ 2.8
* At 0°: PESQ ≈ 1.9
* At +30°: PESQ ≈ 2.4
* At +60°: PESQ ≈ 2.5
**Graph (b):**
* **FF ηSchwarz3 (Red Dotted Line):** The line shows a peak around -30° (approximately 2.85 PESQ score) and a relatively flat trend around 0° (approximately 2.5 PESQ score). It decreases slightly from -30° to 0° and increases from 0° to +60°.
* At -60°: PESQ ≈ 2.7
* At -30°: PESQ ≈ 2.85
* At 0°: PESQ ≈ 2.5
* At +30°: PESQ ≈ 2.55
* At +60°: PESQ ≈ 2.6
* **Binaural ηSchwarz3 (Black Dashed Line):** This line is similar in shape to the Binaural line in graph (a), with a peak around -30° (approximately 2.7 PESQ score) and a trough around 0° (approximately 1.8 PESQ score).
* At -60°: PESQ ≈ 2.6
* At -30°: PESQ ≈ 2.7
* At 0°: PESQ ≈ 1.8
* At +30°: PESQ ≈ 2.3
* At +60°: PESQ ≈ 2.4
### Key Observations
* In both graphs, the "Binaural" lines consistently have lower PESQ scores around 0° compared to the "FF" lines.
* The "Binaural" lines exhibit more significant fluctuations in PESQ scores across the angle range than the "FF" lines.
* The "FF" lines are relatively stable across the angle range, with minor variations.
* Graph (b) shows a slight shift in the peak PESQ score for the "FF" line compared to graph (a).
* The "Binaural" lines in both graphs show a clear minimum around 0 degrees.
### Interpretation
These graphs likely represent the results of a perceptual audio quality evaluation. PESQ (Perceptual Evaluation of Speech Quality) is an objective metric that attempts to predict the perceived quality of speech after transmission or processing. The angle θ likely represents the spatial orientation of the sound source or the listener's head relative to the sound source.
The data suggests that the "FF" (presumably a front-facing or fixed-direction audio processing technique) provides more consistent audio quality across different spatial angles. The "Binaural" processing technique, while potentially offering higher quality in certain spatial configurations (around -30°), is more sensitive to the angle and experiences a significant drop in perceived quality when the sound source is directly in front (0°).
The difference between graphs (a) and (b) (using ηSchwarz2 vs. ηSchwarz3) indicates that the specific parameters or algorithms used in the binaural processing have a noticeable impact on the resulting PESQ scores. The consistent dip in the Binaural lines around 0° suggests a potential issue with the binaural rendering at that specific angle, possibly related to head-related transfer function (HRTF) inaccuracies or limitations. The data highlights the trade-offs between spatial audio processing techniques and the importance of considering the intended listening environment and spatial characteristics.