## Line Chart: PESQ Scores vs. θ (Degrees)
### Overview
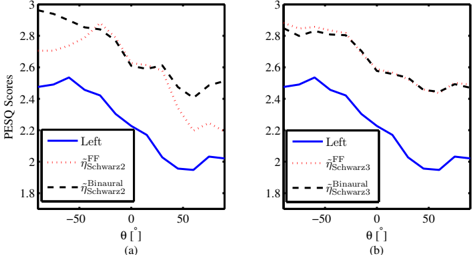
Two line charts (a) and (b) depict PESQ scores across three conditions (Left, η_FF, Binaural) as a function of θ (degrees). Both charts share identical axes and legend placement but differ in line trends.
### Components/Axes
- **X-axis**: θ [°], ranging from -50° to 50° in increments of 10°.
- **Y-axis**: PESQ Scores, ranging from 1.8 to 3.0 in increments of 0.2.
- **Legend**: Located at the bottom-left corner of each chart.
- **Blue solid line**: Left
- **Pink dotted line**: η_FF (Schwarz2 in (a), Schwarz3 in (b))
- **Black dashed line**: Binaural
### Detailed Analysis
#### Chart (a)
- **Left (Blue)**:
- Starts at ~2.5 at -50°, peaks at ~2.5 at -30°, then declines to ~2.0 at 50°.
- Notable dip to ~2.1 at 0°.
- **η_FF (Pink)**:
- Starts at ~2.7 at -50°, peaks at ~2.7 at -10°, then declines to ~2.2 at 50°.
- Sharp drop to ~2.0 at 0°.
- **Binaural (Black)**:
- Starts at ~2.8 at -50°, peaks at ~2.8 at -20°, then declines to ~2.4 at 50°.
- Slight rebound to ~2.5 at 0°.
#### Chart (b)
- **Left (Blue)**:
- Starts at ~2.4 at -50°, peaks at ~2.4 at -25°, then declines to ~2.0 at 50°.
- Sharp drop to ~2.1 at 0°.
- **η_FF (Pink)**:
- Starts at ~2.8 at -50°, peaks at ~2.8 at -15°, then declines to ~2.3 at 50°.
- Sharp drop to ~2.1 at 0°.
- **Binaural (Black)**:
- Starts at ~2.8 at -50°, peaks at ~2.8 at -20°, then declines to ~2.4 at 50°.
- Slight rebound to ~2.5 at 0°.
### Key Observations
1. **Consistent Trends**:
- Binaural consistently achieves the highest PESQ scores across all θ values.
- Left scores are the lowest, with sharper declines as θ increases.
- η_FF scores vary slightly between charts (Schwarz2 vs. Schwarz3) but follow similar patterns.
2. **Peak Positions**:
- Binaural peaks at -20° in both charts.
- η_FF peaks at -10° (a) and -15° (b).
- Left peaks at -30° (a) and -25° (b).
3. **Divergence at θ = 0°**:
- All lines drop sharply at θ = 0°, with η_FF showing the steepest decline.
### Interpretation
- **Performance Implications**:
- Binaural’s higher scores suggest superior performance in the measured metric (e.g., audio quality, signal processing).
- Left’s lower scores and sharper declines indicate reduced effectiveness as θ increases.
- **Condition-Specific Behavior**:
- η_FF (Schwarz2/3) shows intermediate performance, with peaks at moderate negative θ values.
- The divergence in η_FF labels (Schwarz2 vs. Schwarz3) may indicate methodological differences or experimental conditions.
- **θ = 0° Anomaly**:
- The sharp drop at θ = 0° across all conditions suggests a critical threshold or baseline reference point in the data.
### Spatial Grounding
- Legends are consistently placed in the bottom-left corner of both charts.
- Lines are clearly differentiated by color and style (solid, dotted, dashed).
- Axis labels and scales are identical in both charts, ensuring direct comparability.
### Content Details
- **Numerical Approximations**:
- All values are estimated from visual inspection (e.g., ~2.5, ~2.7).
- Uncertainty: ±0.1 due to scale granularity.
- **No Outliers**: All lines follow smooth trends without abrupt deviations.
### Final Notes
The charts highlight the impact of θ on PESQ scores across three conditions. Binaural’s consistent dominance suggests it is the optimal configuration, while Left’s performance degrades more rapidly with increasing θ. The η_FF variations (Schwarz2 vs. Schwarz3) warrant further investigation into their underlying parameters.