# Technical Document Extraction: Control Value Analysis
## Chart Title
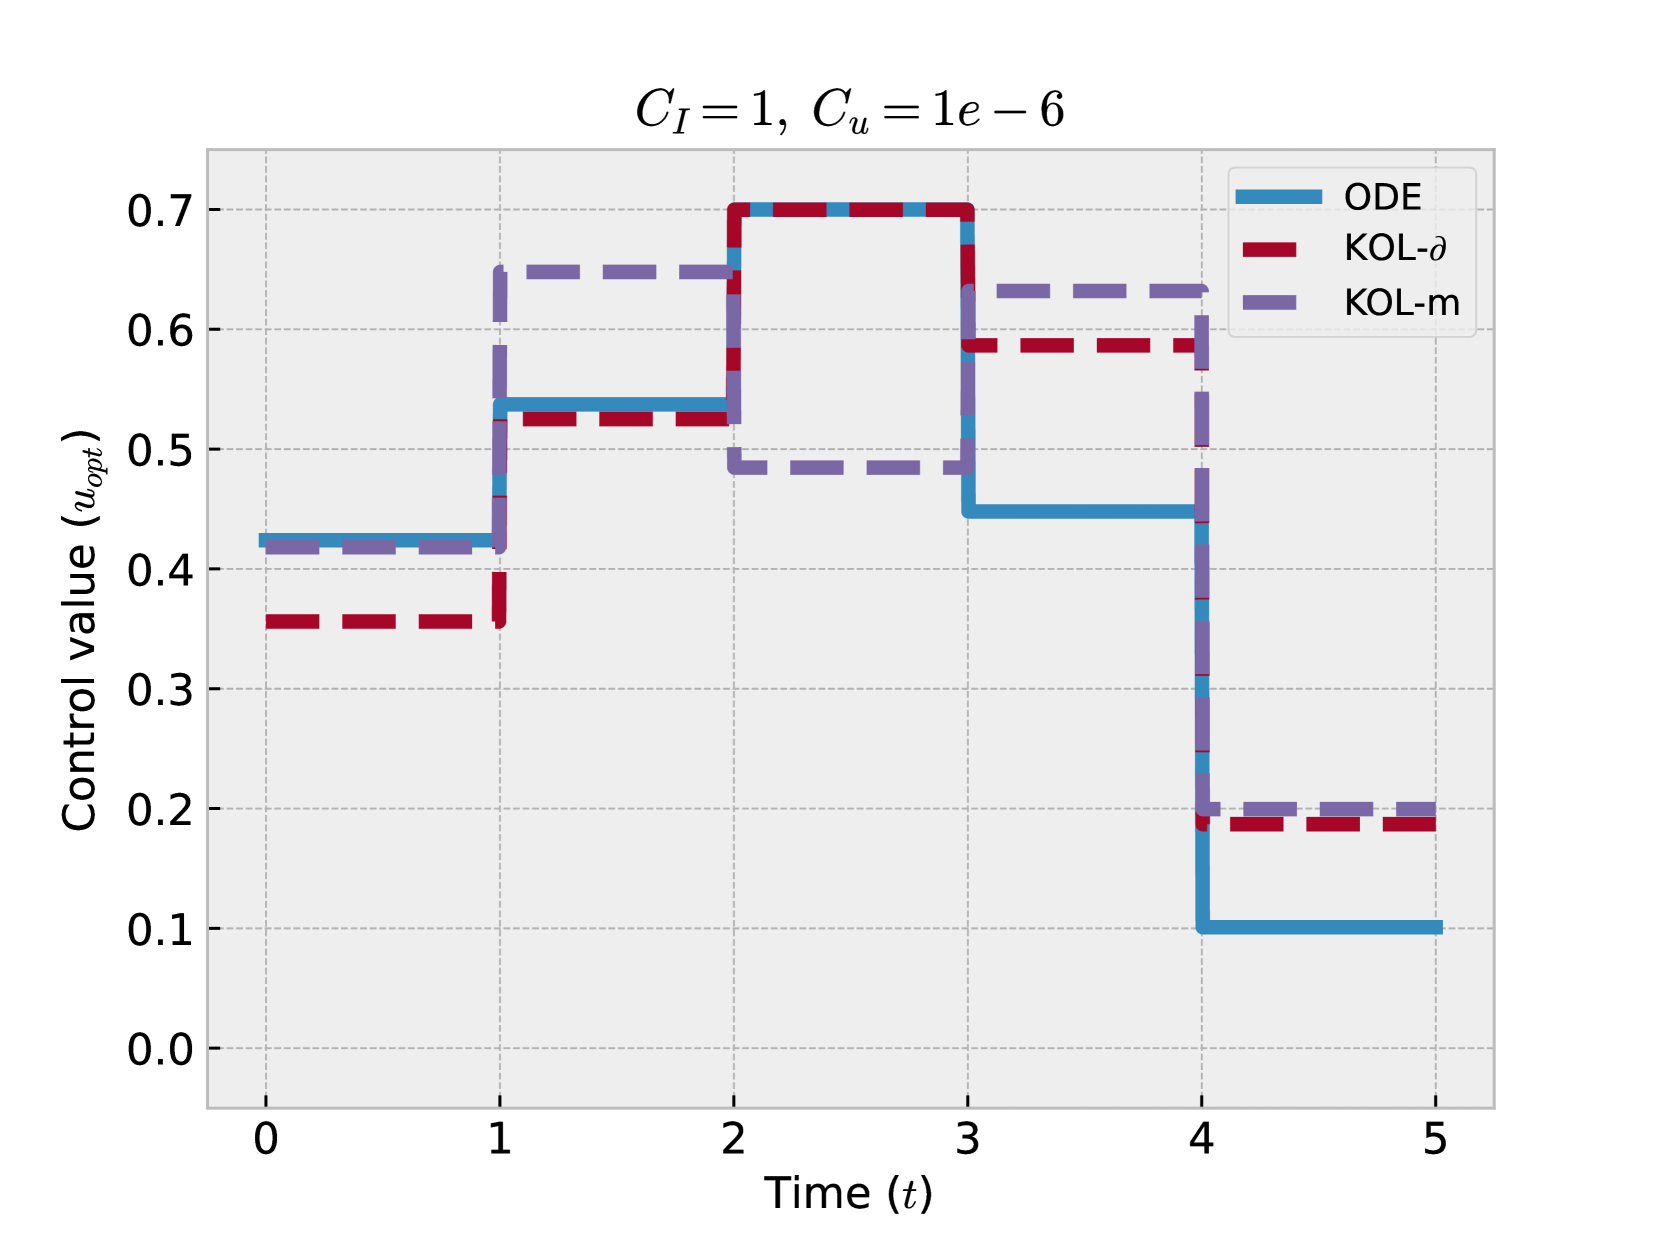
**C_I = 1, C_u = 1e-6**
## Axis Labels
- **X-axis**: Time (t) [0, 1, 2, 3, 4, 5]
- **Y-axis**: Control value (u_opt) [0.0, 0.1, 0.2, 0.3, 0.4, 0.5, 0.6, 0.7]
## Legend
- **ODE**: Solid blue line
- **KOL-δ**: Dashed red line
- **KOL-m**: Dotted purple line
## Key Trends and Data Points
### ODE (Blue)
- **0–1s**: Control value = 0.4
- **1–2s**: Step increase to 0.5
- **2–3s**: Step increase to 0.6
- **3–4s**: Step decrease to 0.4
- **4–5s**: Step decrease to 0.1
### KOL-δ (Red)
- **0–1s**: Control value = 0.35
- **1–2s**: Step increase to 0.5
- **2–3s**: Maintains 0.5
- **3–5s**: Step decrease to 0.35 (held constant)
### KOL-m (Purple)
- **0–1s**: Control value = 0.4
- **1–2s**: Step increase to 0.6
- **2–3s**: Step decrease to 0.5
- **3–4s**: Step increase to 0.6
- **4–5s**: Step decrease to 0.2 (held constant)
## Parameter Context
- **C_I = 1**: Integral gain parameter
- **C_u = 1e-6**: Control update rate constant
## Observations
1. All strategies exhibit stepwise control adjustments at discrete time intervals.
2. ODE shows the most aggressive control value changes (e.g., 0.4 → 0.6 in 1s).
3. KOL-δ maintains stability after initial adjustments (0.5 held for 3s).
4. KOL-m demonstrates oscillatory behavior (0.6 → 0.5 → 0.6) before final stabilization.