\n
## Bar Chart: Model Performance on Various Benchmarks
### Overview
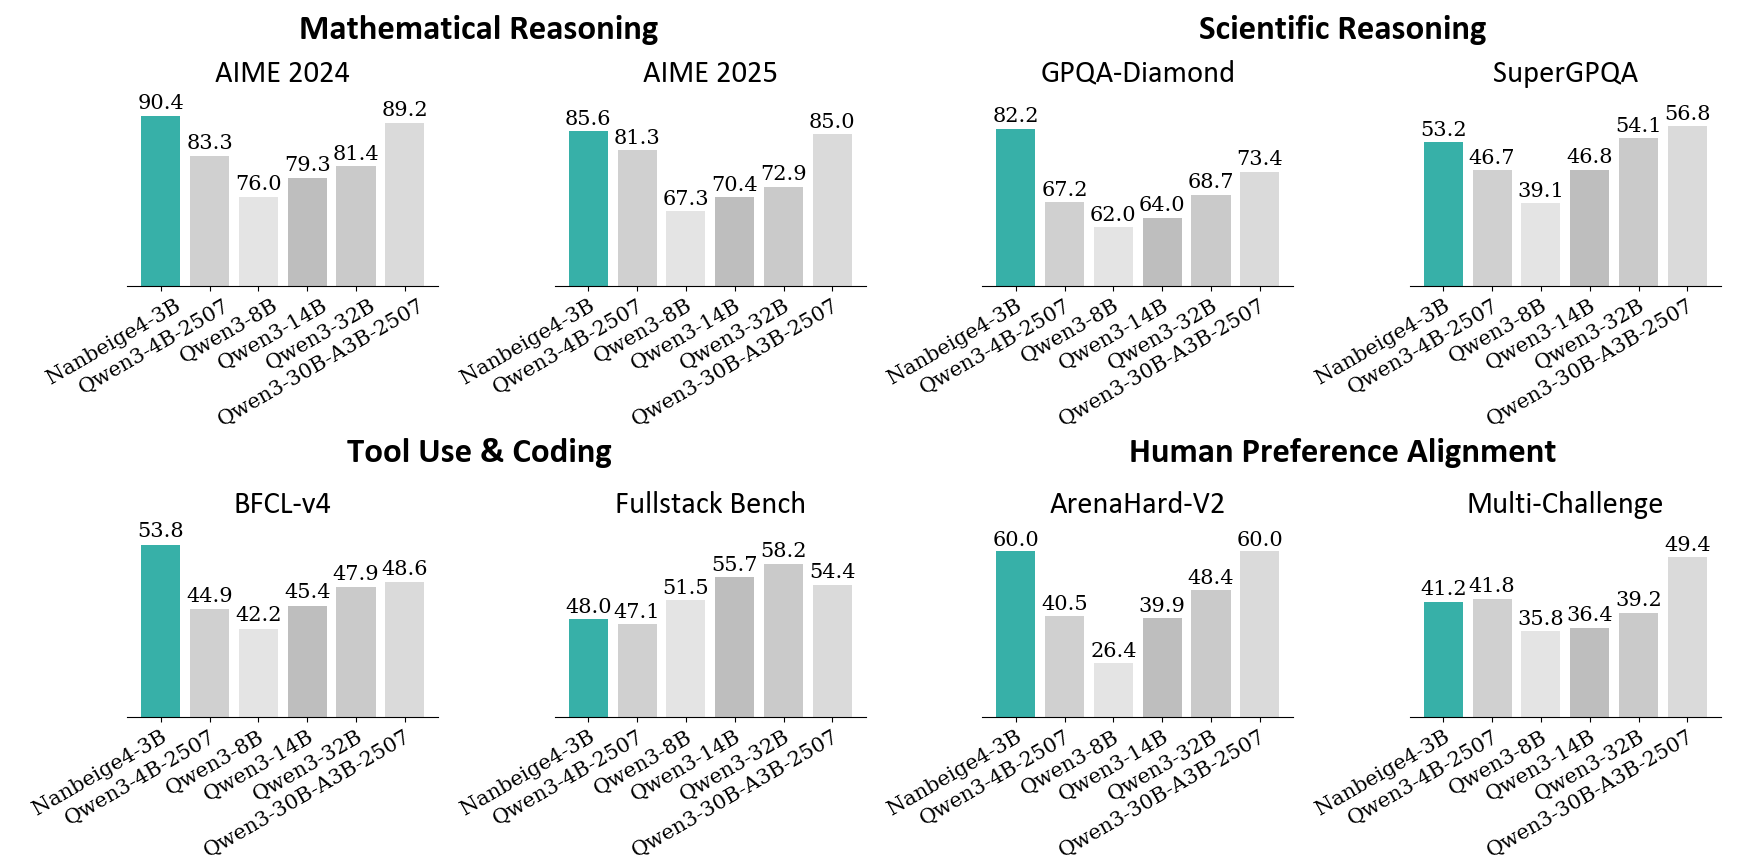
The image presents a bar chart comparing the performance of several language models (NanBeigel-3B, Qwen-3-4B-2507, Qwen3-14B, Qwen3-30B-A3B-2507) across six different benchmarks: AIME 2024, AIME 2025, GPQA-Diamond, SuperGPQA, BFCL-v4, Fullstack Bench, ArenaHard-v2, and Multi-Challenge. The performance metric appears to be a score, likely accuracy or a similar measure.
### Components/Axes
* **X-axis:** Represents the different language models: NanBeigel-3B, Qwen-3-4B-2507, Qwen3-14B, Qwen3-30B-A3B-2507.
* **Y-axis:** Represents the performance score, ranging from approximately 20 to 90. The scale is not explicitly labeled, but can be inferred from the values displayed on the bars.
* **Chart Title:** The chart is divided into sections, each with a title indicating the benchmark being evaluated: Mathematical Reasoning (AIME 2024, AIME 2025), Scientific Reasoning (GPQA-Diamond, SuperGPQA), Tool Use & Coding (BFCL-v4, Fullstack Bench), and Human Preference Alignment (ArenaHard-v2, Multi-Challenge).
* **Bars:** Each bar represents the performance of a specific model on a specific benchmark. The color of the bars is consistent within each benchmark section.
### Detailed Analysis
**Mathematical Reasoning**
* **AIME 2024:**
* NanBeigel-3B: Approximately 90.4
* Qwen-3-4B-2507: Approximately 83.3
* Qwen3-14B: Approximately 79.3
* Qwen3-30B-A3B-2507: Approximately 81.4, 76.0
* **AIME 2025:**
* NanBeigel-3B: Approximately 89.2
* Qwen-3-4B-2507: Approximately 81.3
* Qwen3-14B: Approximately 70.4
* Qwen3-30B-A3B-2507: Approximately 72.9, 85.0
**Scientific Reasoning**
* **GPQA-Diamond:**
* NanBeigel-3B: Approximately 82.2
* Qwen-3-4B-2507: Approximately 67.2
* Qwen3-14B: Approximately 62.0
* Qwen3-30B-A3B-2507: Approximately 64.0, 68.7
* **SuperGPQA:**
* NanBeigel-3B: Approximately 53.2
* Qwen-3-4B-2507: Approximately 46.7
* Qwen3-14B: Approximately 39.1
* Qwen3-30B-A3B-2507: Approximately 54.1, 50.8, 46.8
**Tool Use & Coding**
* **BFCL-v4:**
* NanBeigel-3B: Approximately 53.8
* Qwen-3-4B-2507: Approximately 44.9
* Qwen3-14B: Approximately 45.4
* Qwen3-30B-A3B-2507: Approximately 47.9, 48.6, 42.2
* **Fullstack Bench:**
* NanBeigel-3B: Approximately 58.2
* Qwen-3-4B-2507: Approximately 48.0
* Qwen3-14B: Approximately 47.1
* Qwen3-30B-A3B-2507: Approximately 51.5, 54.4
**Human Preference Alignment**
* **ArenaHard-v2:**
* NanBeigel-3B: Approximately 60.0
* Qwen-3-4B-2507: Approximately 40.5
* Qwen3-14B: Approximately 39.9
* Qwen3-30B-A3B-2507: Approximately 26.4
* **Multi-Challenge:**
* NanBeigel-3B: Approximately 49.4
* Qwen-3-4B-2507: Approximately 41.2
* Qwen3-14B: Approximately 35.8
* Qwen3-30B-A3B-2507: Approximately 36.4, 39.2
### Key Observations
* **NanBeigel-3B consistently outperforms other models** across most benchmarks, particularly in Mathematical and Scientific Reasoning.
* **Qwen3-30B-A3B-2507 often shows the second-best performance**, frequently surpassing Qwen-3-4B-2507 and Qwen3-14B.
* **Qwen3-14B generally performs worse than Qwen-3-4B-2507**, except in some instances within the Tool Use & Coding category.
* **Performance varies significantly across benchmarks.** Models that excel in one area may not perform as well in others.
* The presence of multiple bars for Qwen3-30B-A3B-2507 in some benchmarks suggests multiple runs or variations of the model were evaluated.
### Interpretation
The data suggests that NanBeigel-3B is the strongest performing model among those tested, demonstrating superior capabilities in mathematical, scientific, and general reasoning tasks. Qwen3-30B-A3B-2507 represents a significant step up in performance compared to the smaller Qwen models, indicating that increasing model size generally leads to improved results. The varying performance across benchmarks highlights the importance of evaluating models on a diverse set of tasks to gain a comprehensive understanding of their strengths and weaknesses. The multiple bars for Qwen3-30B-A3B-2507 could indicate the impact of different training configurations or data subsets on the model's performance. The relatively lower scores on the Human Preference Alignment benchmarks suggest that these tasks may be more challenging for the models, or that the evaluation metrics do not fully capture human preferences. Overall, the chart provides valuable insights into the relative performance of these language models and can inform future research and development efforts.