## Bar Chart: AI Model Performance Across Benchmarks
### Overview
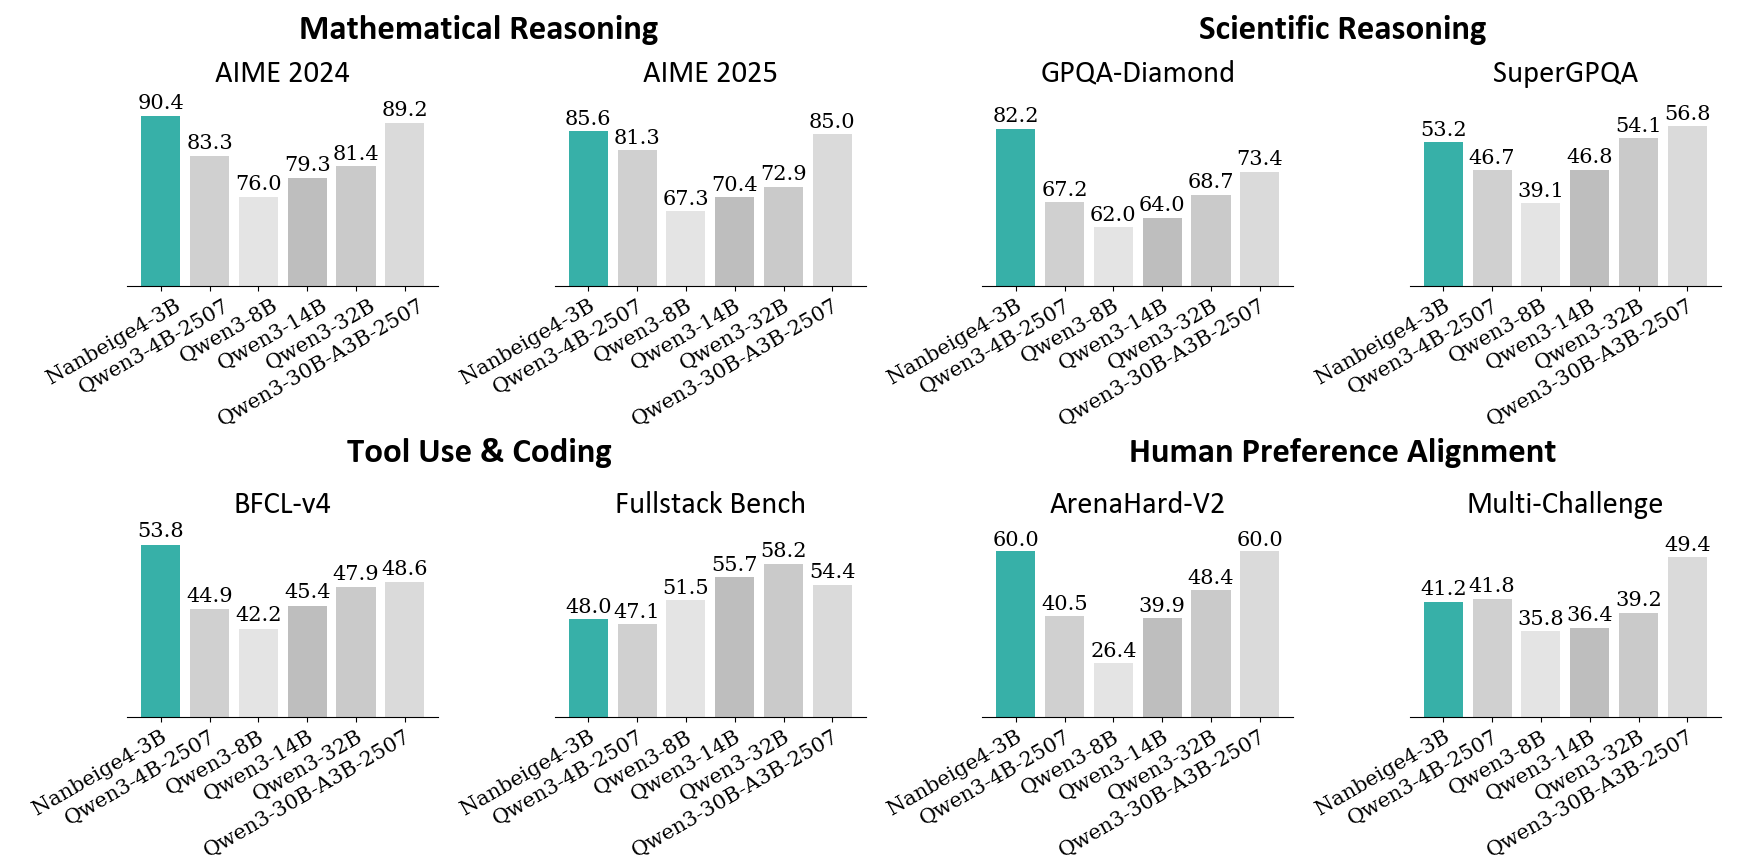
The image presents a comparative analysis of six AI models across multiple reasoning and capability benchmarks. The chart is divided into four main sections: Mathematical Reasoning, Scientific Reasoning, Tool Use & Coding, and Human Preference Alignment. Each section contains two subsections comparing performance across different years (2024 vs. 2025) or benchmark types (e.g., AIME vs. GPQA).
### Components/Axes
- **X-axis**: AI models (Nanbeige4-3B, Gwen3-4B-2507, Gwen3-3B-8B, Gwen3-3B-14B, Gwen3-3B-32B, Gwen3-30B-A3B-2507)
- **Y-axis**: Performance scores (percentage values)
- **Legend**: Color-coded model identifiers (teal, gray, white)
- **Sections**:
1. Mathematical Reasoning (AIME 2024/2025)
2. Scientific Reasoning (GPQA-Diamond/SuperGPQA)
3. Tool Use & Coding (BFCL-v4/Fullstack Bench)
4. Human Preference Alignment (ArenaHard-V2/Multi-Challenge)
### Detailed Analysis
#### Mathematical Reasoning
- **AIME 2024**:
- Nanbeige4-3B: 90.4% (teal)
- Gwen3-4B-2507: 83.3% (gray)
- Gwen3-3B-8B: 76.0% (white)
- Gwen3-3B-14B: 79.3% (gray)
- Gwen3-3B-32B: 81.4% (gray)
- Gwen3-30B-A3B-2507: 89.2% (gray)
- **AIME 2025**:
- Nanbeige4-3B: 85.6% (teal)
- Gwen3-4B-2507: 81.3% (gray)
- Gwen3-3B-8B: 67.3% (white)
- Gwen3-3B-14B: 70.4% (gray)
- Gwen3-3B-32B: 72.9% (gray)
- Gwen3-30B-A3B-2507: 85.0% (gray)
#### Scientific Reasoning
- **GPQA-Diamond**:
- Nanbeige4-3B: 82.2% (teal)
- Gwen3-4B-2507: 67.2% (gray)
- Gwen3-3B-8B: 62.0% (white)
- Gwen3-3B-14B: 64.0% (gray)
- Gwen3-3B-32B: 68.7% (gray)
- Gwen3-30B-A3B-2507: 73.4% (gray)
- **SuperGPQA**:
- Nanbeige4-3B: 53.2% (teal)
- Gwen3-4B-2507: 46.7% (gray)
- Gwen3-3B-8B: 39.1% (white)
- Gwen3-3B-14B: 46.8% (gray)
- Gwen3-3B-32B: 54.1% (gray)
- Gwen3-30B-A3B-2507: 56.8% (gray)
#### Tool Use & Coding
- **BFCL-v4**:
- Nanbeige4-3B: 53.8% (teal)
- Gwen3-4B-2507: 44.9% (gray)
- Gwen3-3B-8B: 42.2% (white)
- Gwen3-3B-14B: 45.4% (gray)
- Gwen3-3B-32B: 47.9% (gray)
- Gwen3-30B-A3B-2507: 48.6% (gray)
- **Fullstack Bench**:
- Nanbeige4-3B: 48.0% (teal)
- Gwen3-4B-2507: 47.1% (gray)
- Gwen3-3B-8B: 51.5% (white)
- Gwen3-3B-14B: 55.7% (gray)
- Gwen3-3B-32B: 58.2% (gray)
- Gwen3-30B-A3B-2507: 54.4% (gray)
#### Human Preference Alignment
- **ArenaHard-V2**:
- Nanbeige4-3B: 60.0% (teal)
- Gwen3-4B-2507: 40.5% (gray)
- Gwen3-3B-8B: 26.4% (white)
- Gwen3-3B-14B: 39.9% (gray)
- Gwen3-3B-32B: 48.4% (gray)
- Gwen3-30B-A3B-2507: 60.0% (gray)
- **Multi-Challenge**:
- Nanbeige4-3B: 41.2% (teal)
- Gwen3-4B-2507: 41.8% (gray)
- Gwen3-3B-8B: 35.8% (white)
- Gwen3-3B-14B: 36.4% (gray)
- Gwen3-3B-32B: 39.2% (gray)
- Gwen3-30B-A3B-2507: 49.4% (gray)
### Key Observations
1. **2025 Models Outperform 2024 in Most Technical Tasks**:
- Gwen3-30B-A3B-2507 consistently achieves the highest scores across all benchmarks except ArenaHard-V2.
- AIME 2025 shows a 4.2% average improvement over AIME 2024 for Gwen3 models.
2. **Human Preference Alignment Anomaly**:
- Gwen3-30B-A3B-2507 matches Nanbeige4-3B in ArenaHard-V2 (60.0%) but underperforms in Multi-Challenge (49.4% vs. 41.2%).
- Gwen3-3B-8B shows the largest drop in Human Preference Alignment (26.4% vs. 35.8% in Multi-Challenge).
3. **Tool Use & Coding Trends**:
- Fullstack Bench scores are 10-15% higher than BFCL-v4 across all models.
- Gwen3-3B-32B demonstrates the steepest improvement in Fullstack Bench (58.2% vs. 47.9% in BFCL-v4).
### Interpretation
The data suggests that newer Gwen3 models (2025) exhibit significant improvements in technical reasoning and coding capabilities compared to their 2024 counterparts. However, the Human Preference Alignment section reveals a critical divergence: while Gwen3-30B-A3B-2507 matches Nanbeige4-3B in ArenaHard-V2, its Multi-Challenge score (49.4%) remains below Nanbeige4-3B's 41.2%, indicating potential misalignment with human expectations in complex scenarios. This could imply that while technical capabilities have advanced, value alignment and nuanced decision-making remain challenges for larger models. The consistent performance of Gwen3-3B-32B in Fullstack Bench (58.2%) suggests specialized training in coding tasks yields disproportionate gains compared to general reasoning improvements.