TECHNICAL ASSET FINGERPRINT
0a4f0c091d57048c966f12ab
Click to view fullscreen
Press ESC or click to close
FOUND IN PAPERS
EXPERT: gemma-3-27b-it-free VERSION 1
RUNTIME: google-free/gemma-3-27b-it
INTEL_VERIFIED
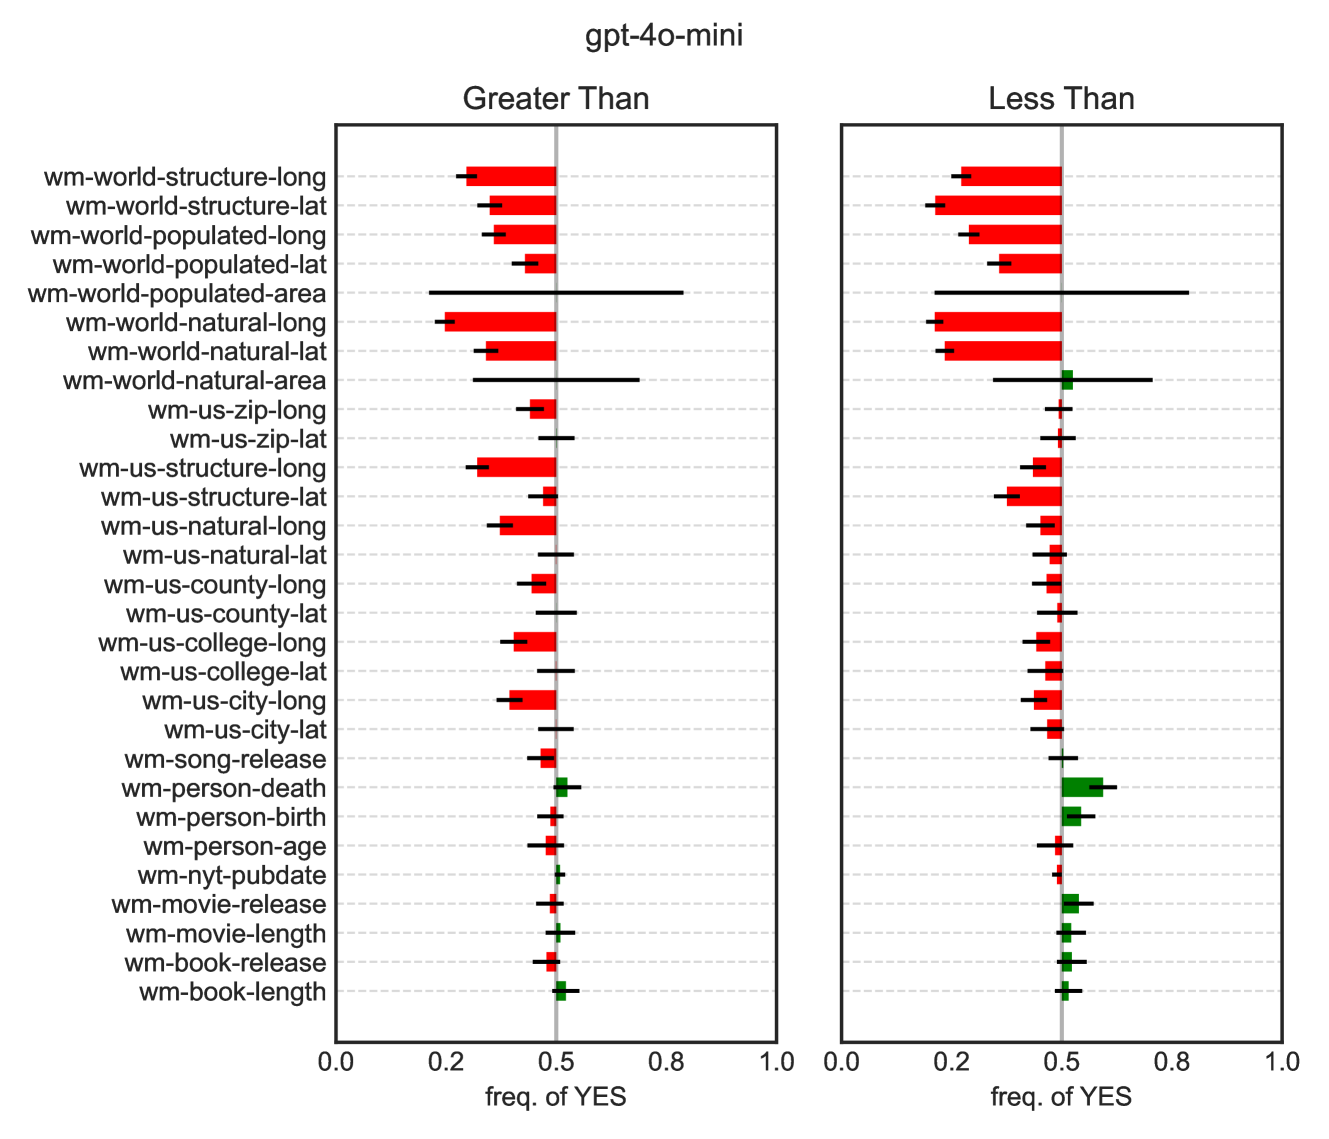
## Chart: Frequency of "YES" Responses - Greater Than vs. Less Than
### Overview
The image presents a comparative chart displaying the frequency of "YES" responses for various world and US-based categories, split into two conditions: "Greater Than" and "Less Than". The chart utilizes horizontal box plots to visualize the distribution of frequencies for each category under both conditions. The x-axis represents the frequency of "YES", ranging from 0.0 to 1.0.
### Components/Axes
* **Title:** "gpt-4o-mini" (positioned at the top-center)
* **Subtitles:** "Greater Than" (top-left) and "Less Than" (top-right)
* **Y-axis:** Lists the following categories (from top to bottom):
* wm-world-structure-long
* wm-world-structure-lat
* wm-world-populated-long
* wm-world-populated-lat
* wm-world-populated-area
* wm-world-natural-long
* wm-world-natural-lat
* wm-world-natural-area
* wm-us-zip-long
* wm-us-zip-lat
* wm-us-structure-long
* wm-us-structure-lat
* wm-us-natural-long
* wm-us-natural-lat
* wm-us-county-long
* wm-us-college-long
* wm-us-college-lat
* wm-us-city-long
* wm-us-city-lat
* wm-song-release
* wm-person-death
* wm-person-birth
* wm-person-age
* wm-nyt-pubdate
* wm-movie-release
* wm-movie-length
* wm-book-release
* wm-book-length
* **X-axis:** "freq. of YES" (shared by both sub-charts), ranging from 0.0 to 1.0.
* **Box Plot Colors:** Red for "Greater Than", Teal for "Less Than".
* **Vertical Grid Lines:** Light gray, spaced at 0.2, 0.4, 0.6, 0.8, and 1.0 on the x-axis.
### Detailed Analysis
The chart consists of two sets of box plots, one for "Greater Than" and one for "Less Than". Each box plot represents the distribution of "YES" frequencies for a specific category. The box plots show the median, quartiles, and potential outliers.
**Greater Than:**
* **wm-world-structure-long:** Median ~0.55, IQR ~0.35-0.75, some outliers above 0.8.
* **wm-world-structure-lat:** Median ~0.50, IQR ~0.35-0.65, outliers above 0.7.
* **wm-world-populated-long:** Median ~0.60, IQR ~0.45-0.75.
* **wm-world-populated-lat:** Median ~0.55, IQR ~0.40-0.70.
* **wm-world-populated-area:** Median ~0.50, IQR ~0.35-0.65.
* **wm-world-natural-long:** Median ~0.50, IQR ~0.35-0.65.
* **wm-world-natural-lat:** Median ~0.45, IQR ~0.30-0.60.
* **wm-world-natural-area:** Median ~0.40, IQR ~0.25-0.55.
* **wm-us-zip-long:** Median ~0.50, IQR ~0.35-0.65.
* **wm-us-zip-lat:** Median ~0.45, IQR ~0.30-0.60.
* **wm-us-structure-long:** Median ~0.55, IQR ~0.40-0.70.
* **wm-us-structure-lat:** Median ~0.50, IQR ~0.35-0.65.
* **wm-us-natural-long:** Median ~0.50, IQR ~0.35-0.65.
* **wm-us-natural-lat:** Median ~0.45, IQR ~0.30-0.60.
* **wm-us-county-long:** Median ~0.55, IQR ~0.40-0.70.
* **wm-us-college-long:** Median ~0.60, IQR ~0.45-0.75.
* **wm-us-college-lat:** Median ~0.55, IQR ~0.40-0.70.
* **wm-us-city-long:** Median ~0.55, IQR ~0.40-0.70.
* **wm-us-city-lat:** Median ~0.50, IQR ~0.35-0.65.
* **wm-song-release:** Median ~0.50, IQR ~0.35-0.65.
* **wm-person-death:** Median ~0.50, IQR ~0.35-0.65.
* **wm-person-birth:** Median ~0.50, IQR ~0.35-0.65.
* **wm-person-age:** Median ~0.50, IQR ~0.35-0.65.
* **wm-nyt-pubdate:** Median ~0.50, IQR ~0.35-0.65.
* **wm-movie-release:** Median ~0.50, IQR ~0.35-0.65.
* **wm-movie-length:** Median ~0.50, IQR ~0.35-0.65.
* **wm-book-release:** Median ~0.50, IQR ~0.35-0.65.
* **wm-book-length:** Median ~0.45, IQR ~0.30-0.60.
**Less Than:**
* **wm-world-structure-long:** Median ~0.45, IQR ~0.30-0.60, outliers above 0.7.
* **wm-world-structure-lat:** Median ~0.40, IQR ~0.25-0.55.
* **wm-world-populated-long:** Median ~0.45, IQR ~0.30-0.60.
* **wm-world-populated-lat:** Median ~0.40, IQR ~0.25-0.55.
* **wm-world-populated-area:** Median ~0.40, IQR ~0.25-0.55.
* **wm-world-natural-long:** Median ~0.40, IQR ~0.25-0.55.
* **wm-world-natural-lat:** Median ~0.35, IQR ~0.20-0.50.
* **wm-world-natural-area:** Median ~0.30, IQR ~0.15-0.45.
* **wm-us-zip-long:** Median ~0.40, IQR ~0.25-0.55.
* **wm-us-zip-lat:** Median ~0.35, IQR ~0.20-0.50.
* **wm-us-structure-long:** Median ~0.45, IQR ~0.30-0.60.
* **wm-us-structure-lat:** Median ~0.40, IQR ~0.25-0.55.
* **wm-us-natural-long:** Median ~0.40, IQR ~0.25-0.55.
* **wm-us-natural-lat:** Median ~0.35, IQR ~0.20-0.50.
* **wm-us-county-long:** Median ~0.45, IQR ~0.30-0.60.
* **wm-us-college-long:** Median ~0.50, IQR ~0.35-0.65.
* **wm-us-college-lat:** Median ~0.45, IQR ~0.30-0.60.
* **wm-us-city-long:** Median ~0.45, IQR ~0.30-0.60.
* **wm-us-city-lat:** Median ~0.40, IQR ~0.25-0.55.
* **wm-song-release:** Median ~0.40, IQR ~0.25-0.55.
* **wm-person-death:** Median ~0.40, IQR ~0.25-0.55.
* **wm-person-birth:** Median ~0.40, IQR ~0.25-0.55.
* **wm-person-age:** Median ~0.40, IQR ~0.25-0.55.
* **wm-nyt-pubdate:** Median ~0.40, IQR ~0.25-0.55.
* **wm-movie-release:** Median ~0.40, IQR ~0.25-0.55.
* **wm-movie-length:** Median ~0.40, IQR ~0.25-0.55.
* **wm-book-release:** Median ~0.40, IQR ~0.25-0.55.
* **wm-book-length:** Median ~0.35, IQR ~0.20-0.50.
### Key Observations
* Generally, the "Greater Than" condition tends to have higher median frequencies of "YES" responses compared to the "Less Than" condition for most categories.
* Categories related to population (wm-world-populated-long, wm-world-populated-lat, wm-world-populated-area) show relatively higher frequencies in the "Greater Than" condition.
* Categories related to natural features (wm-world-natural-long, wm-world-natural-lat, wm-world-natural-area) have lower frequencies in both conditions.
* The "wm-book-length" category consistently shows lower frequencies in both conditions.
* There is a noticeable spread (larger IQR) in some categories, indicating more variability in the "YES" frequencies.
### Interpretation
This chart appears to be evaluating the performance of a model (gpt-4o-mini) on a series of binary classification tasks. Each category represents a different feature or entity, and the model is determining whether a given value is "Greater Than" or "Less Than" some threshold. The frequency of "YES" responses indicates the model's confidence or accuracy in making that determination.
The higher frequencies in the "Greater Than" condition suggest that the model is more confident or accurate when predicting whether a value is greater than a certain threshold. The differences in frequencies across categories likely reflect the inherent difficulty of the classification task for each feature. For example, population-related features might be easier to classify than natural features, leading to higher frequencies.
The spread of the box plots indicates the consistency of the model's predictions. A wider spread suggests more variability, potentially due to ambiguity in the data or limitations in the model's ability to generalize. The outliers represent cases where the model's predictions are significantly different from the majority, which could indicate errors or unusual data points. The consistent lower performance on "wm-book-length" suggests this feature is particularly challenging for the model.
DECODING INTELLIGENCE...