TECHNICAL ASSET FINGERPRINT
0a4f0c091d57048c966f12ab
Click to view fullscreen
Press ESC or click to close
FOUND IN PAPERS
EXPERT: healer-alpha-free VERSION 1
RUNTIME: free/openrouter/healer-alpha
INTEL_VERIFIED
## [Chart Type]: Comparative Frequency Analysis (Greater Than vs. Less Than)
### Overview
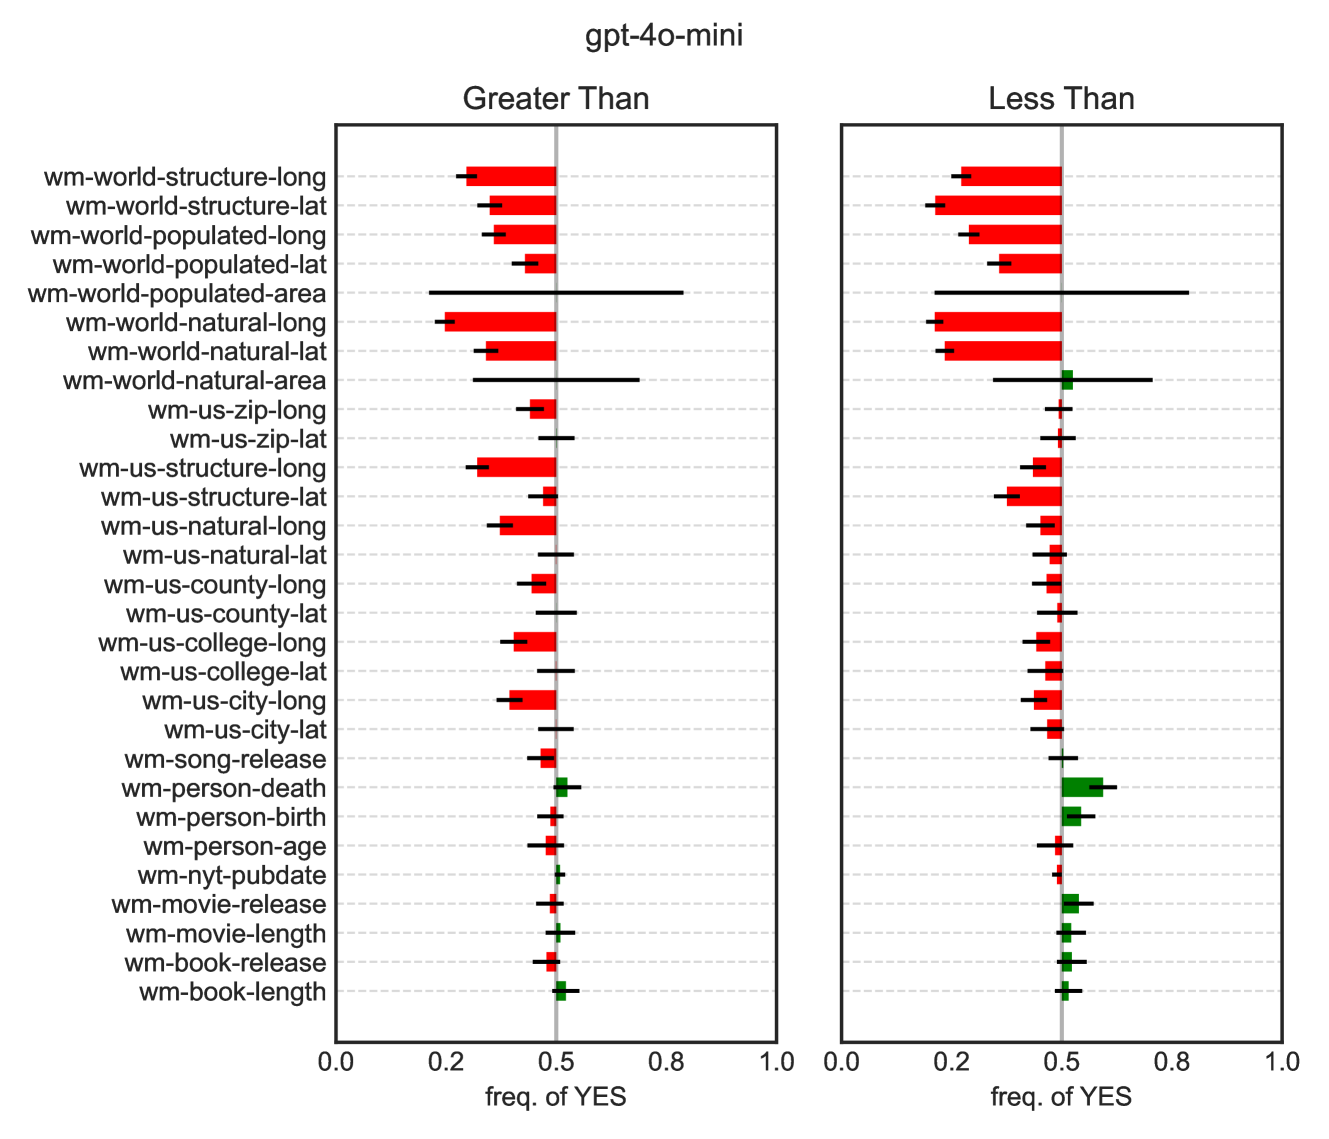
This image displays a comparative statistical chart for a model identified as "gpt-4o-mini". It consists of two side-by-side horizontal bar charts sharing a common y-axis of categorical labels. The charts compare the "frequency of YES" responses for two different conditions or question types: "Greater Than" (left panel) and "Less Than" (right panel). The data appears to measure model performance or response bias across a variety of tasks, primarily related to geographical, temporal, and biographical facts.
### Components/Axes
* **Main Title:** "gpt-4o-mini" (centered at the top).
* **Panel Titles:**
* Left Panel: "Greater Than"
* Right Panel: "Less Than"
* **Y-Axis (Shared):** A vertical list of 29 categorical task labels. All labels are prefixed with "wm-". From top to bottom:
1. `wm-world-structure-long`
2. `wm-world-structure-lat`
3. `wm-world-populated-long`
4. `wm-world-populated-lat`
5. `wm-world-populated-area`
6. `wm-world-natural-long`
7. `wm-world-natural-lat`
8. `wm-world-natural-area`
9. `wm-us-zip-long`
10. `wm-us-zip-lat`
11. `wm-us-structure-long`
12. `wm-us-structure-lat`
13. `wm-us-natural-long`
14. `wm-us-natural-lat`
15. `wm-us-county-long`
16. `wm-us-county-lat`
17. `wm-us-college-long`
18. `wm-us-college-lat`
19. `wm-us-city-long`
20. `wm-us-city-lat`
21. `wm-song-release`
22. `wm-person-death`
23. `wm-person-birth`
24. `wm-person-age`
25. `wm-nyt-pubdate`
26. `wm-movie-release`
27. `wm-movie-length`
28. `wm-book-release`
29. `wm-book-length`
* **X-Axis (Both Panels):** Labeled "freq. of YES". The scale runs from 0.0 to 1.0, with major tick marks at 0.0, 0.2, 0.5, 0.8, and 1.0. A vertical gray line is drawn at the 0.5 (50%) mark in both panels.
* **Data Representation:** Each category has a horizontal bar with an associated error bar (black line). The bar's color indicates its position relative to the 0.5 threshold:
* **Red Bar:** The bar extends leftward from the 0.5 line, indicating a frequency of YES **less than 0.5**.
* **Green Bar:** The bar extends rightward from the 0.5 line, indicating a frequency of YES **greater than 0.5**.
* The length of the colored bar represents the magnitude of the deviation from 0.5. The black error bar line indicates the range of uncertainty or variance around the measured frequency.
### Detailed Analysis
**Trend Verification & Spatial Grounding:**
* **"Greater Than" Panel (Left):**
* **World Tasks (Top 8):** All bars are **red**, indicating frequencies below 0.5. The values range approximately from 0.25 to 0.45. `wm-world-populated-area` has an exceptionally wide error bar, spanning from ~0.15 to ~0.85, indicating high uncertainty.
* **US Tasks (Next 12):** Predominantly **red** bars. Most values cluster between 0.3 and 0.5. `wm-us-zip-lat` is a notable exception with a very small red bar, nearly at 0.5.
* **Person/Media Tasks (Bottom 9):** A shift occurs. `wm-song-release` is red (~0.45). `wm-person-death` and `wm-person-birth` are **green** (~0.55). `wm-person-age` is red (~0.45). `wm-nyt-pubdate` is green (~0.52). `wm-movie-release`, `wm-movie-length`, `wm-book-release`, and `wm-book-length` are all **green**, with values between ~0.52 and ~0.58.
* **"Less Than" Panel (Right):**
* **World Tasks:** Mostly **red**, similar to the left panel. However, `wm-world-natural-area` is **green** (~0.55), contrasting with its red counterpart in the "Greater Than" panel.
* **US Tasks:** Mostly **red**. `wm-us-zip-lat` is **green** (~0.55), again contrasting with the left panel.
* **Person/Media Tasks:** Strongly **green**. `wm-person-death` shows the highest frequency in the entire chart, approximately **0.7**. `wm-person-birth` (~0.6), `wm-nyt-pubdate` (~0.52), `wm-movie-release` (~0.58), `wm-movie-length` (~0.55), `wm-book-release` (~0.58), and `wm-book-length` (~0.55) are all green. `wm-person-age` remains red (~0.45).
**Key Data Points (Approximate):**
* Highest Frequency (YES): `wm-person-death` in the "Less Than" panel (~0.7).
* Lowest Frequency (YES): Several world/US structure tasks in the "Greater Than" panel (~0.25-0.3).
* Highest Uncertainty: `wm-world-populated-area` in both panels (error bar span > 0.7).
* Most Consistent Green Tasks: `wm-movie-release`, `wm-book-release` (green in both panels).
* Most Consistent Red Tasks: `wm-world-structure-long`, `wm-us-structure-long` (red in both panels).
### Key Observations
1. **Task-Type Dichotomy:** There is a clear performance split. Tasks involving **geographical/spatial data** (world/US structure, populated areas, natural features) consistently yield a low frequency of "YES" responses (red bars). Tasks involving **temporal/biographical data** (person death/birth, movie/book release dates/lengths) yield a higher frequency of "YES" responses (green bars).
2. **Condition Sensitivity:** A few tasks show inverted performance between the "Greater Than" and "Less Than" conditions. Most notably, `wm-world-natural-area` and `wm-us-zip-lat` are red in one panel and green in the other, suggesting the model's response bias flips based on the question's comparative direction.
3. **High Variance:** The `wm-world-populated-area` task has extremely large error bars in both panels, indicating the model's responses for this task are highly inconsistent or the measurement has low confidence.
4. **Asymmetry in Person Tasks:** While `wm-person-death` and `wm-person-birth` show high "YES" frequencies, `wm-person-age` does not, remaining below 0.5 in both conditions.
### Interpretation
This chart likely visualizes the results of a benchmark evaluating the `gpt-4o-mini` model's ability to correctly answer comparative questions (e.g., "Is X greater than Y?"). The "freq. of YES" probably represents the proportion of times the model answered affirmatively.
The data suggests a significant **domain-specific bias** in the model's knowledge or reasoning:
* **Geographical/Spatial Reasoning Weakness:** The model struggles with tasks requiring precise comparison of geographical coordinates (latitude/longitude), areas, or structural data, often answering "NO" (frequency < 0.5). This could indicate gaps in its training data for precise spatial relationships or a difficulty in performing the underlying numerical comparison.
* **Temporal/Biographical Reasoning Strength:** Conversely, the model is more confident (answering "YES" > 50% of the time) when comparing dates, ages, and durations related to people and media. This may reflect a stronger memorization of factual timelines or an easier reasoning pattern for these data types.
* **Question Framing Matters:** The flip in performance for `wm-world-natural-area` and `wm-us-zip-lat` between "Greater Than" and "Less Than" conditions is critical. It implies the model's answer is not solely based on the underlying fact but is influenced by the *direction of the comparison*. This could point to a learned bias in how the model processes comparative language or an artifact in the dataset construction.
In summary, the chart reveals that `gpt-4o-mini`'s performance on comparative factual questions is not uniform. It exhibits strong, consistent patterns of success and failure tied to the *type of data* being compared (spatial vs. temporal) and is sensitive to the *phrasing* of the comparison itself. The high uncertainty on certain tasks further highlights areas where the model's knowledge is unreliable.
DECODING INTELLIGENCE...