## Line Chart: CIFAR-100 Test Accuracy vs. d1
### Overview
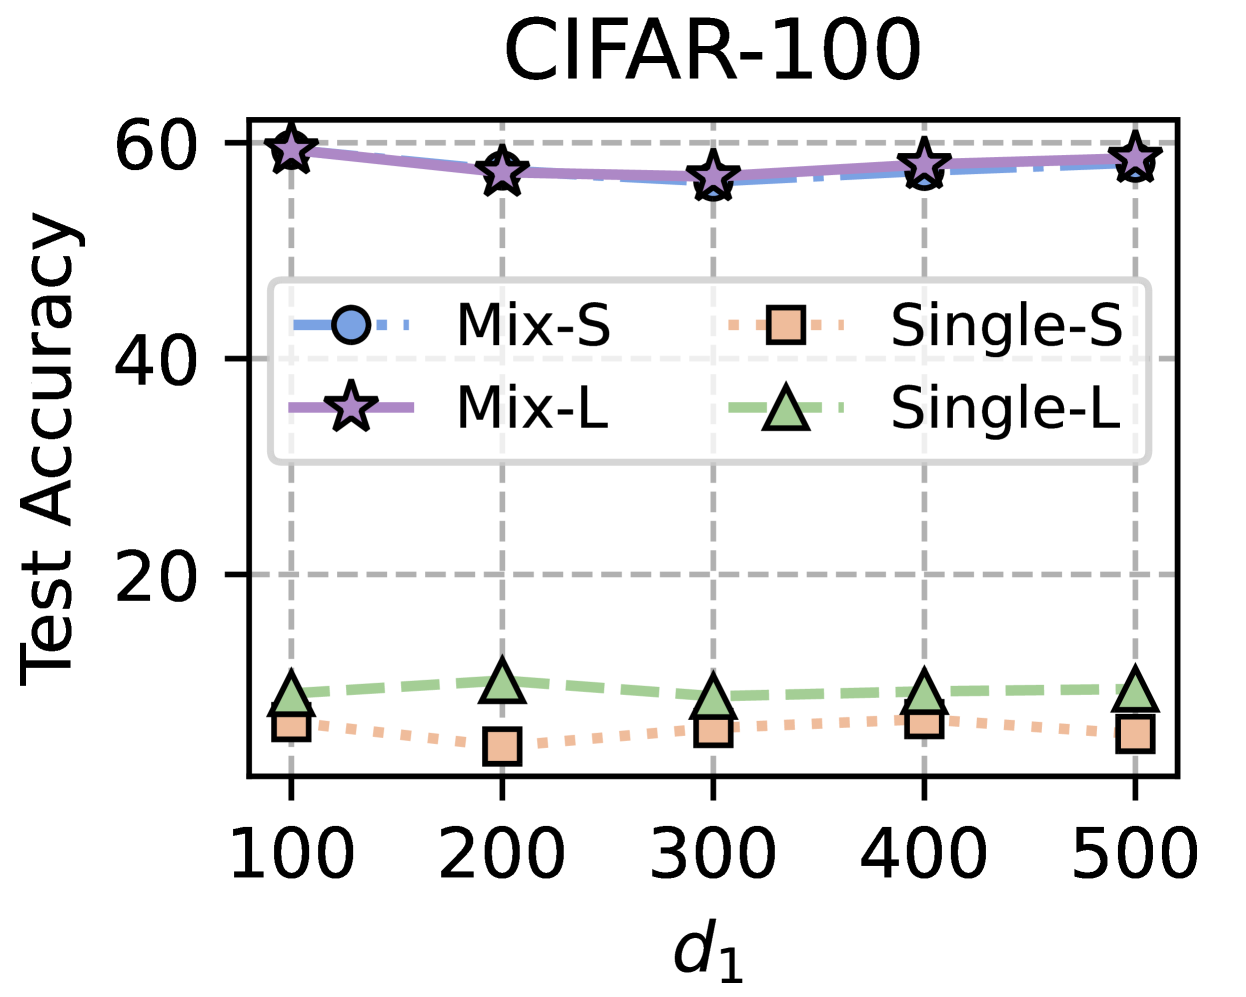
This line chart displays the test accuracy of different model configurations on the CIFAR-100 dataset, plotted against the parameter 'd1'. Four distinct model configurations are compared: Mix-S, Mix-L, Single-S, and Single-L. The chart shows how test accuracy changes as 'd1' varies from 100 to 500.
### Components/Axes
* **Title:** CIFAR-100 (centered at the top)
* **X-axis:** Labeled "d1", ranging from 100 to 500, with tick marks at 100, 200, 300, 400, and 500.
* **Y-axis:** Labeled "Test Accuracy", ranging from 0 to 60, with tick marks at 0, 20, 40, and 60.
* **Legend:** Located in the top-center of the chart.
* Mix-S (Blue, Circle with dotted line)
* Mix-L (Purple, Star with dotted line)
* Single-S (Orange, Square with dotted line)
* Single-L (Green, Triangle with dotted line)
* **Gridlines:** Horizontal dashed lines at Test Accuracy values of 20 and 40. Vertical dashed lines at d1 values of 100, 200, 300, 400, and 500.
### Detailed Analysis
* **Mix-S (Blue):** The line representing Mix-S starts at approximately 58% accuracy at d1=100 and remains relatively stable, fluctuating slightly around 58% until d1=500.
* d1 = 100: ~58%
* d1 = 200: ~57%
* d1 = 300: ~58%
* d1 = 400: ~58%
* d1 = 500: ~58%
* **Mix-L (Purple):** The line for Mix-L also begins at approximately 58% accuracy at d1=100 and remains consistently around this level, with minimal variation, until d1=500.
* d1 = 100: ~58%
* d1 = 200: ~58%
* d1 = 300: ~58%
* d1 = 400: ~58%
* d1 = 500: ~58%
* **Single-S (Orange):** The Single-S line starts at approximately 10% accuracy at d1=100 and remains relatively flat, fluctuating around 10-12% throughout the range of d1 values.
* d1 = 100: ~10%
* d1 = 200: ~11%
* d1 = 300: ~10%
* d1 = 400: ~11%
* d1 = 500: ~10%
* **Single-L (Green):** The Single-L line begins at approximately 8% accuracy at d1=100 and remains consistently low, fluctuating around 8-10% across all d1 values.
* d1 = 100: ~8%
* d1 = 200: ~9%
* d1 = 300: ~8%
* d1 = 400: ~9%
* d1 = 500: ~8%
### Key Observations
* Mix-S and Mix-L consistently achieve significantly higher test accuracy (around 58%) compared to Single-S and Single-L (around 8-12%).
* The test accuracy for all four configurations remains relatively stable across the range of d1 values (100 to 500). There is no clear trend of increasing or decreasing accuracy with changes in d1.
* Single-L consistently exhibits the lowest test accuracy among the four configurations.
### Interpretation
The data suggests that the "Mix" configurations (Mix-S and Mix-L) are substantially more effective than the "Single" configurations (Single-S and Single-L) in achieving high test accuracy on the CIFAR-100 dataset. The parameter 'd1' appears to have a minimal impact on test accuracy within the tested range, indicating that the model performance is not highly sensitive to changes in this parameter. The consistent performance of Mix-S and Mix-L suggests that the mixing strategy employed in these configurations is beneficial for learning robust features from the CIFAR-100 data. The low accuracy of Single-S and Single-L may indicate that these configurations struggle to generalize well to the dataset, potentially due to limitations in their model capacity or training process. The lack of a clear trend with respect to 'd1' suggests that other factors, such as model architecture or training hyperparameters, may play a more significant role in determining the overall performance.