## Line Graph: CIFAR-100 Test Accuracy vs. d₁
### Overview
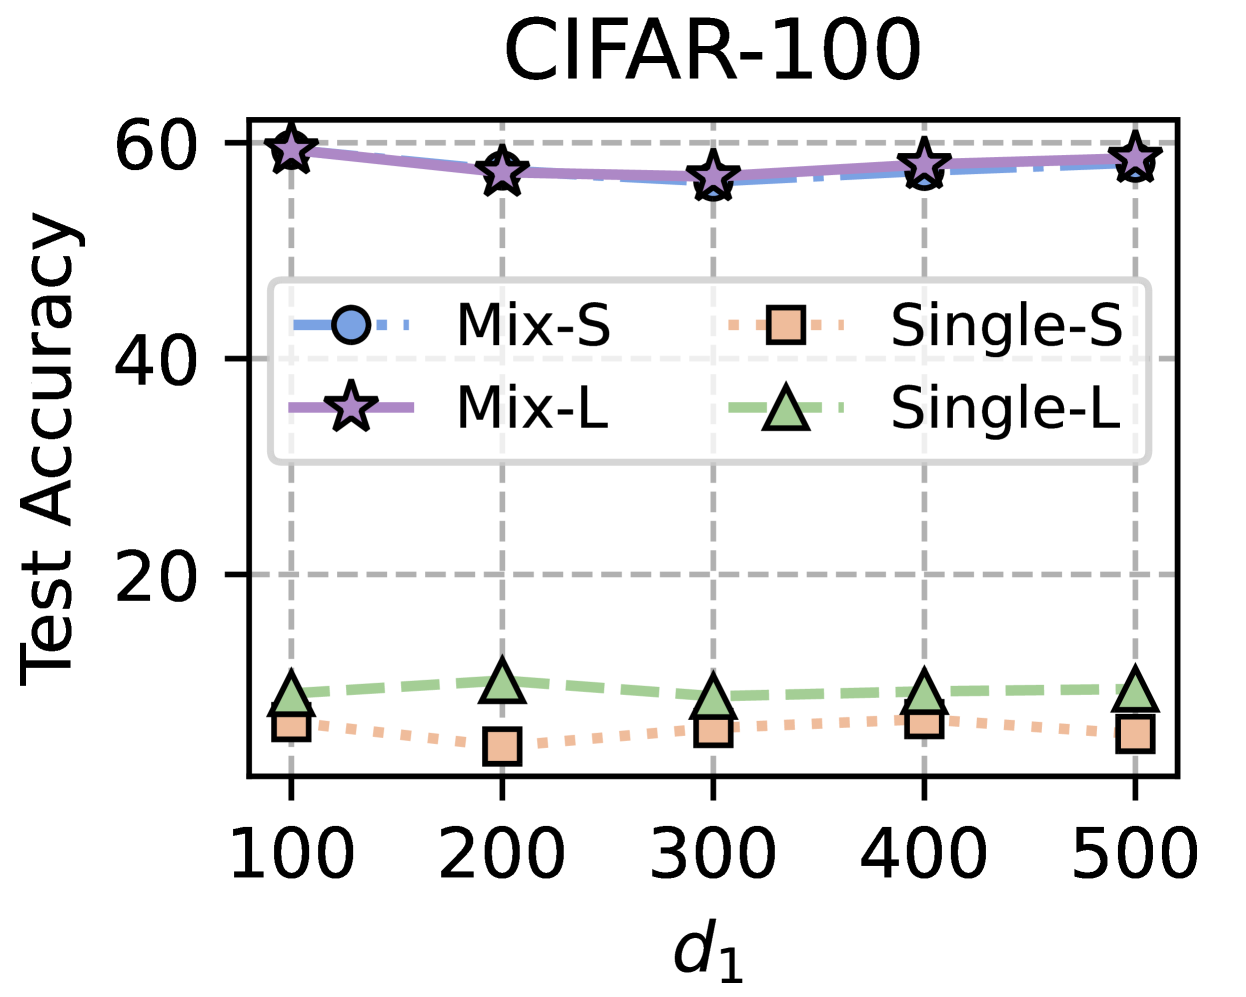
The graph compares test accuracy across four model configurations (Mix-S, Mix-L, Single-S, Single-L) as a function of the parameter `d₁` (ranging from 100 to 500). Test accuracy is measured on the y-axis (0–60), while `d₁` is on the x-axis. The Mix models (Mix-S and Mix-L) consistently outperform the Single models (Single-S and Single-L) across all `d₁` values.
### Components/Axes
- **X-axis (d₁)**: Labeled with values 100, 200, 300, 400, 500.
- **Y-axis (Test Accuracy)**: Labeled with values 0, 20, 40, 60.
- **Legend**: Located at the top-right corner, with four entries:
- **Mix-S**: Blue circles (dashed line).
- **Mix-L**: Purple stars (solid line).
- **Single-S**: Orange squares (dotted line).
- **Single-L**: Green triangles (dashed-dotted line).
### Detailed Analysis
1. **Mix-S (Blue Circles)**:
- Test accuracy starts at ~58 at `d₁=100`, dips to ~55 at `d₁=200`, then rises to ~57 at `d₁=500`.
- Trend: Slightly fluctuating but stable around 55–58.
2. **Mix-L (Purple Stars)**:
- Test accuracy starts at ~59 at `d₁=100`, dips to ~56 at `d₁=200`, then rises to ~58 at `d₁=500`.
- Trend: Similar to Mix-S but slightly higher overall.
3. **Single-S (Orange Squares)**:
- Test accuracy remains flat at ~10–12 across all `d₁` values.
- Trend: Minimal variation, consistently low.
4. **Single-L (Green Triangles)**:
- Test accuracy starts at ~12 at `d₁=100`, dips to ~10 at `d₁=200`, then rises to ~13 at `d₁=500`.
- Trend: Slightly variable but remains below 15.
### Key Observations
- **Performance Gap**: Mix models (S and L) achieve ~5x higher accuracy than Single models (S and L).
- **Stability**: Mix models show minor fluctuations but maintain high accuracy. Single models are stable but perform poorly.
- **Parameter Sensitivity**: No clear trend in accuracy improvement with increasing `d₁` for any model type.
### Interpretation
The data suggests that Mix models (Mix-S and Mix-L) are significantly more effective than Single models (Single-S and Single-L) for the CIFAR-100 dataset. The minimal improvement in accuracy with increasing `d₁` implies that the parameter `d₁` may not be a critical factor for these models in this context. The consistent performance of Mix models highlights their robustness, while the flat accuracy of Single models indicates potential limitations in their architecture or training methodology.