## Chart Type: Zoomed-in ROC Curve
### Overview
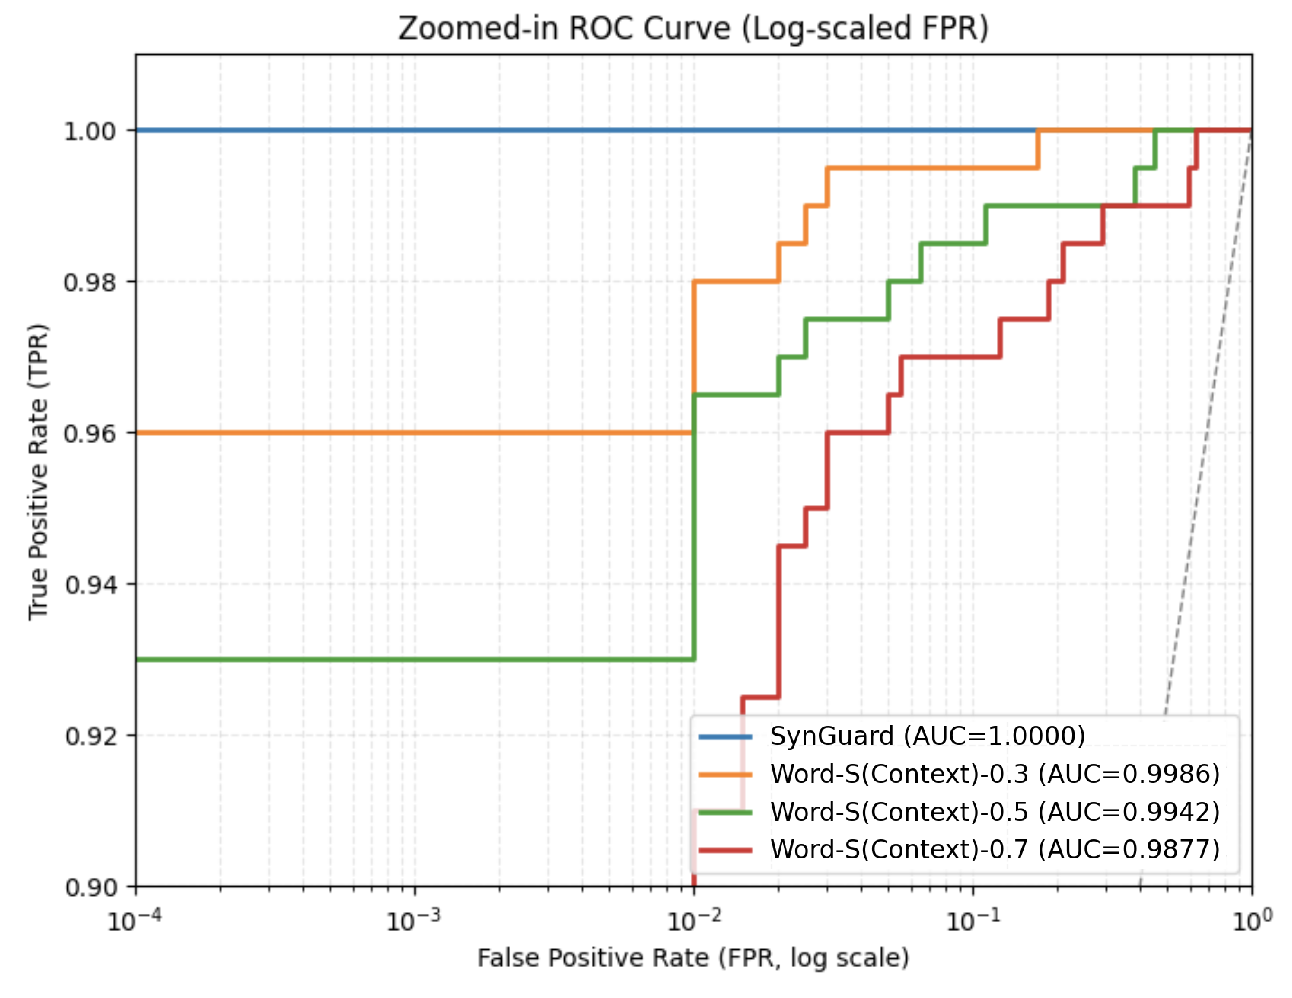
The image is a Receiver Operating Characteristic (ROC) curve, zoomed in on the top-left corner, plotting True Positive Rate (TPR) against False Positive Rate (FPR) on a log scale. It compares the performance of different models: SynGuard, Word-S(Context)-0.3, Word-S(Context)-0.5, and Word-S(Context)-0.7. The Area Under the Curve (AUC) is provided for each model in the legend.
### Components/Axes
* **Title:** Zoomed-in ROC Curve (Log-scaled FPR)
* **X-axis:** False Positive Rate (FPR, log scale). Scale ranges from 10^-4 to 10^0. Axis markers are present at 10^-4, 10^-3, 10^-2, 10^-1, and 10^0.
* **Y-axis:** True Positive Rate (TPR). Scale ranges from 0.90 to 1.00. Axis markers are present at 0.90, 0.92, 0.94, 0.96, 0.98, and 1.00.
* **Legend:** Located in the bottom-right corner. It identifies the models and their corresponding AUC values:
* Blue: SynGuard (AUC=1.0000)
* Orange: Word-S(Context)-0.3 (AUC=0.9986)
* Green: Word-S(Context)-0.5 (AUC=0.9942)
* Red: Word-S(Context)-0.7 (AUC=0.9877)
* A dashed grey line extends from the bottom left to the top right of the chart.
### Detailed Analysis
* **SynGuard (Blue):** The line is horizontal at TPR = 1.00 across the entire FPR range.
* **Word-S(Context)-0.3 (Orange):** The line starts at approximately FPR = 10^-4 and TPR = 0.96, then rises to TPR = 0.98 at approximately FPR = 10^-2, and finally reaches TPR = 1.00 at approximately FPR = 0.1.
* **Word-S(Context)-0.5 (Green):** The line starts at approximately FPR = 10^-4 and TPR = 0.93, then rises to TPR = 0.965 at approximately FPR = 0.01, then rises to TPR = 0.99 at approximately FPR = 0.1, and finally reaches TPR = 1.00 at approximately FPR = 0.3.
* **Word-S(Context)-0.7 (Red):** The line starts at approximately FPR = 10^-4 and TPR = 0.93, then rises to TPR = 0.945 at approximately FPR = 0.01, then rises to TPR = 0.975 at approximately FPR = 0.1, and finally reaches TPR = 1.00 at approximately FPR = 0.8.
### Key Observations
* SynGuard has the highest AUC (1.0000) and maintains a perfect True Positive Rate across all False Positive Rates.
* The performance of the Word-S(Context) models decreases as the numerical suffix increases (0.3 > 0.5 > 0.7), as indicated by their AUC values.
* All models eventually reach a TPR of 1.00, but at different FPR values.
### Interpretation
The ROC curve visualizes the trade-off between the true positive rate and the false positive rate for different models. SynGuard demonstrates ideal performance, perfectly classifying positive cases without incurring any false positives. The Word-S(Context) models show varying degrees of performance, with higher suffix values indicating a lower AUC and a slower rise to a perfect TPR. The plot highlights the superior performance of SynGuard in this zoomed-in region of the ROC space, suggesting it is the most accurate model for the given task. The dashed grey line represents a classifier that performs no better than random chance.