## Chart/Diagram Type: Zoomed-in ROC Curve (Log-scaled FPR)
### Overview
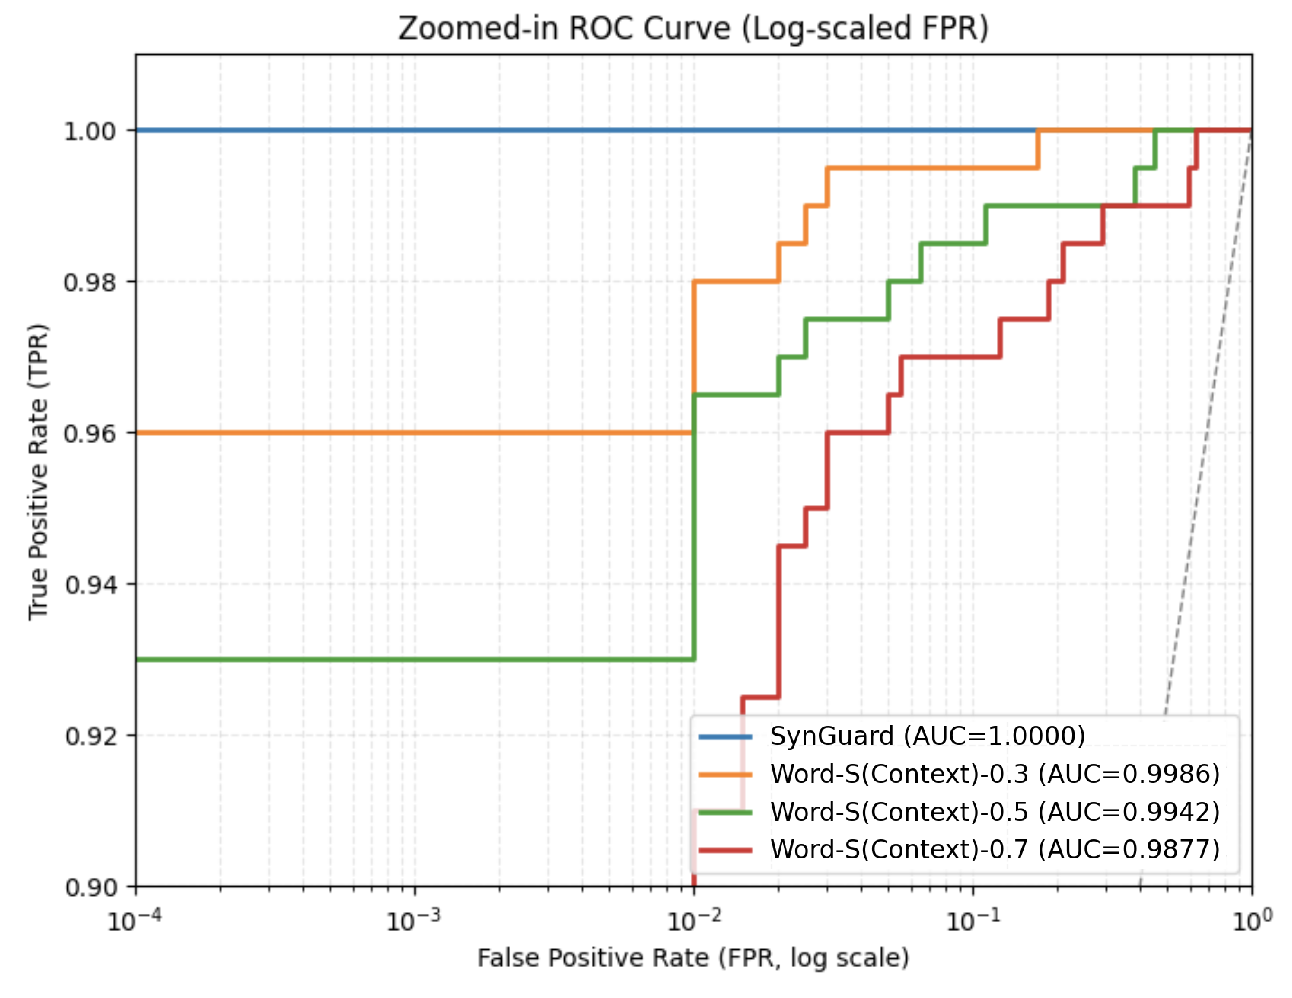
The image displays a zoomed-in Receiver Operating Characteristic (ROC) curve with a log-scaled False Positive Rate (FPR) axis. It compares the performance of four models: SynGuard and three variants of Word-S with different context parameters. The curve highlights trade-offs between TPR and FPR, with AUC (Area Under the Curve) values provided for each model.
### Components/Axes
- **X-axis**: False Positive Rate (FPR, log scale) ranging from 10⁻⁴ to 10⁰.
- **Y-axis**: True Positive Rate (TPR) ranging from 0.90 to 1.00.
- **Legend**: Located in the bottom-right corner, with four entries:
- **Blue**: SynGuard (AUC=1.0000)
- **Orange**: Word-S(Context)-0.3 (AUC=0.9986)
- **Green**: Word-S(Context)-0.5 (AUC=0.9942)
- **Red**: Word-S(Context)-0.7 (AUC=0.9877)
- **Dashed Line**: Represents the diagonal baseline (TPR = FPR).
### Detailed Analysis
1. **SynGuard (Blue Line)**:
- **Trend**: Horizontal line at TPR=1.00 across all FPR values.
- **Key Data Points**:
- FPR=10⁻⁴ → TPR=1.00
- FPR=10⁻³ → TPR=1.00
- FPR=10⁻² → TPR=1.00
- FPR=10⁻¹ → TPR=1.00
- FPR=10⁰ → TPR=1.00
- **AUC**: 1.0000 (perfect performance).
2. **Word-S(Context)-0.3 (Orange Line)**:
- **Trend**: Stepwise increase in TPR as FPR increases.
- **Key Data Points**:
- FPR=10⁻² → TPR=0.96
- FPR=10⁻¹ → TPR=0.98
- FPR=10⁰ → TPR=1.00
- **AUC**: 0.9986.
3. **Word-S(Context)-0.5 (Green Line)**:
- **Trend**: Stepwise increase in TPR as FPR increases.
- **Key Data Points**:
- FPR=10⁻² → TPR=0.93
- FPR=10⁻¹ → TPR=0.96
- FPR=10⁰ → TPR=0.98
- **AUC**: 0.9942.
4. **Word-S(Context)-0.7 (Red Line)**:
- **Trend**: Stepwise increase in TPR as FPR increases.
- **Key Data Points**:
- FPR=10⁻² → TPR=0.90
- FPR=10⁻¹ → TPR=0.94
- FPR=10⁰ → TPR=0.97
- **AUC**: 0.9877.
### Key Observations
- **SynGuard** achieves perfect TPR (1.00) across all FPR values, indicating no false positives.
- **Word-S** models show diminishing performance with lower context parameters (e.g., -0.7 vs. -0.3).
- The log-scaled FPR axis emphasizes performance at low FPR ranges (e.g., 10⁻² to 10⁻¹).
- The dashed baseline (TPR = FPR) is visually distinct, confirming the models outperform random guessing.
### Interpretation
- **Model Performance**: SynGuard dominates with a perfect ROC curve, suggesting it is the most reliable model. The Word-S models, while effective, exhibit trade-offs between TPR and FPR, with lower context parameters (e.g., -0.7) resulting in higher FPR for equivalent TPR.
- **Log-Scale Insight**: The log-scaled FPR axis highlights the models' ability to handle extreme FPR values, which is critical for applications requiring high precision.
- **Context Parameter Impact**: The decline in AUC from 0.9986 (Context -0.3) to 0.9877 (Context -0.7) indicates that reducing context sensitivity degrades model performance.
- **Practical Implications**: SynGuard’s flawless TPR suggests it is ideal for scenarios where false positives are unacceptable, while Word-S models may be preferable when balancing TPR and FPR is necessary.