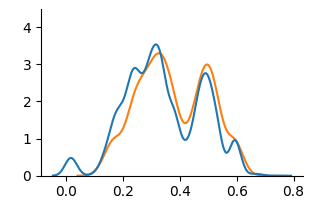
## Line Graph: Unlabeled Comparison of Two Data Series
### Overview
The image depicts a line graph with two overlapping data series (blue and orange lines) plotted against a Cartesian coordinate system. The x-axis ranges from 0.0 to 0.8, and the y-axis ranges from 0 to 4. Both lines exhibit oscillatory behavior with peaks and troughs, though the blue line (Line A) shows greater volatility compared to the orange line (Line B).
### Components/Axes
- **X-Axis**: Labeled with values from 0.0 to 0.8 in increments of 0.2. No explicit title provided.
- **Y-Axis**: Labeled with values from 0 to 4 in increments of 1. No explicit title provided.
- **Legend**: Located in the top-right corner, associating:
- **Blue line**: "Line A"
- **Orange line**: "Line B"
### Detailed Analysis
#### Line A (Blue)
- **Trend**: Starts near 0 at x=0.0, rises to a peak of ~3.5 at x=0.3, dips to ~1.0 at x=0.4, rises again to ~3.0 at x=0.5, and declines to ~0.1 at x=0.8.
- **Key Data Points**:
- x=0.0: ~0.1
- x=0.3: ~3.5
- x=0.4: ~1.0
- x=0.5: ~3.0
- x=0.8: ~0.1
#### Line B (Orange)
- **Trend**: Starts near 0 at x=0.0, rises to a peak of ~3.2 at x=0.3, dips to ~1.2 at x=0.4, rises again to ~3.2 at x=0.55, and declines to ~0.1 at x=0.8.
- **Key Data Points**:
- x=0.0: ~0.1
- x=0.3: ~3.2
- x=0.4: ~1.2
- x=0.55: ~3.2
- x=0.8: ~0.1
### Key Observations
1. **Volatility**: Line A (blue) exhibits sharper fluctuations (e.g., rapid rise/fall between x=0.3 and x=0.4) compared to Line B (orange), which has smoother transitions.
2. **Peak Alignment**: Both lines peak near x=0.3 and x=0.5–0.55, but Line A’s second peak is slightly earlier (x=0.5 vs. x=0.55 for Line B).
3. **Intersection Points**: The lines intersect near x=0.3 (both ~3.3) and x=0.5 (Line A ~3.0, Line B ~3.2).
4. **End Behavior**: Both lines converge to ~0.1 at x=0.8, suggesting a shared endpoint.
### Interpretation
The graph likely compares two variables or conditions (e.g., performance metrics, environmental factors) over a normalized scale (x-axis). The blue line’s volatility could indicate instability or external influences, while the orange line’s smoother trajectory suggests consistency. The shared endpoint at x=0.8 implies a common outcome or boundary condition. The intersections at x=0.3 and x=0.5 may represent equilibrium points or critical thresholds where the two variables align.
**Note**: Exact numerical values are approximate due to the absence of gridlines or labeled data points. The legend confirms color-to-label mapping, and spatial grounding aligns with standard line graph conventions.