\n
## Diagram: Kernel Operation Illustration
### Overview
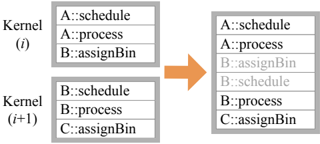
The image depicts a diagram illustrating an operation performed on two "Kernel" data structures, labeled (i) and (i+1). The diagram shows the contents of each kernel before and after an operation, indicated by an orange arrow. The operation appears to involve combining the contents of the two kernels into a single, larger kernel.
### Components/Axes
The diagram consists of three main sections:
1. **Kernel (i)**: A table with three rows and one column.
2. **Kernel (i+1)**: A table with three rows and one column.
3. **Resultant Kernel**: A table with six rows and one column.
Each row within the kernels contains a label in the format "Letter::Function". The labels are:
* A::schedule
* A::process
* B::assignBin
* B::schedule
* B::process
* C::assignBin
### Detailed Analysis or Content Details
**Kernel (i):**
* Row 1: A::schedule
* Row 2: A::process
* Row 3: B::assignBin
**Kernel (i+1):**
* Row 1: B::schedule
* Row 2: B::process
* Row 3: C::assignBin
**Resultant Kernel:**
* Row 1: A::schedule
* Row 2: A::process
* Row 3: B::assignBin
* Row 4: B::schedule
* Row 5: B::process
* Row 6: C::assignBin
The resultant kernel appears to be a concatenation of the contents of Kernel (i) and Kernel (i+1). The order of the rows in the resultant kernel is first all rows from Kernel (i), followed by all rows from Kernel (i+1).
### Key Observations
The operation appears to be a simple appending of the contents of Kernel (i+1) to Kernel (i). The labels within each kernel are consistent in their format. The letters A, B, and C are used, suggesting a possible categorization or indexing scheme.
### Interpretation
This diagram likely illustrates a step in a larger process, possibly related to task scheduling or resource allocation. The "Kernels" could represent sets of tasks or operations. The operation shown – appending Kernel (i+1) to Kernel (i) – could represent adding new tasks to an existing schedule or merging resource allocations. The use of "schedule", "process", and "assignBin" suggests these are the types of operations being managed. The diagram demonstrates a sequential addition of operations, potentially representing a time-based progression (i to i+1). The letters A, B, and C could represent different priorities, resources, or agents responsible for the tasks. Without further context, it's difficult to determine the precise meaning of this operation, but it clearly demonstrates a method for combining and managing a set of labeled operations.