## Diagram: Kernel Task Scheduling and Merging
### Overview
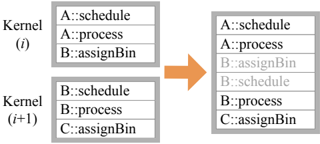
The image is a technical diagram illustrating a process of task merging or interleaving from two computational kernels into a single execution sequence. It visually represents how tasks labeled with specific identifiers (A, B, C) and operations (schedule, process, assignBin) are combined from two separate kernel contexts into one ordered list, with a visual distinction (color) applied to tasks originating from the second kernel.
### Components/Axes
The diagram consists of three primary rectangular boxes and a directional arrow.
1. **Left Side - Input Kernels (Two Boxes Stacked Vertically):**
* **Top Box:** Labeled `Kernel (i)`. Contains a vertical list of three tasks.
* **Bottom Box:** Labeled `Kernel (i+1)`. Contains a vertical list of three tasks.
* **Arrow:** A solid orange arrow originates from the right edge of the space between the two left boxes and points to the single box on the right, indicating a transformation or mapping process.
2. **Right Side - Output Sequence (One Box):**
* A single, taller rectangular box containing a vertical list of six tasks. This box has no explicit label.
### Detailed Analysis
**Task Lists and Transcription:**
* **Kernel (i) Tasks (Top-Left Box):**
1. `A::schedule`
2. `A::process`
3. `B::assignBin`
* **Kernel (i+1) Tasks (Bottom-Left Box):**
1. `B::schedule`
2. `B::process`
3. `C::assignBin`
* **Merged Output Sequence (Right Box):**
The tasks are listed in the following order. The first three entries are in **black text**, and the last three entries are in **light gray text**.
1. `A::schedule` (Black)
2. `A::process` (Black)
3. `B::assignBin` (Black)
4. `B::schedule` (Gray)
5. `B::process` (Gray)
6. `C::assignBin` (Gray)
**Spatial Grounding & Color Mapping:**
* The legend is implicit in the color coding of the text within the right-hand box.
* **Black Text:** Corresponds exactly to the three tasks from `Kernel (i)`. They occupy the top half (positions 1-3) of the output list.
* **Gray Text:** Corresponds exactly to the three tasks from `Kernel (i+1)`. They occupy the bottom half (positions 4-6) of the output list.
* The orange arrow is a visual connector, not a data series, and does not map to a legend item.
**Flow and Relationship:**
The diagram shows a direct, ordered concatenation. The entire list from `Kernel (i)` is placed first, followed immediately by the entire list from `Kernel (i+1)`. There is no interleaving (e.g., A, B, A, B) or reordering based on task type. The relationship is a simple sequential merge.
### Key Observations
1. **Strict Sequential Merge:** The output is a pure concatenation of the two input lists in their original order (`Kernel (i)` then `Kernel (i+1)`).
2. **Visual Differentiation by Origin:** The only difference between the tasks in the output list is their text color, which serves as a visual marker of their source kernel. All task text content is preserved exactly.
3. **Task Naming Convention:** Tasks follow a consistent `Identifier::Operation` format (e.g., `A::schedule`). The identifiers (A, B, C) suggest different data objects or resources, while the operations (schedule, process, assignBin) suggest a pipeline of actions performed on them.
4. **Kernel Indexing:** The use of `(i)` and `(i+1)` implies these are consecutive instances or iterations of a kernel execution, possibly in a loop or sequence.
### Interpretation
This diagram likely illustrates a **task scheduling or dependency resolution strategy** in a parallel or pipelined computing system, such as a GPU warp scheduler or a CPU thread pool manager.
* **What it demonstrates:** It shows a conservative merging strategy where all tasks from one kernel context are completed before any tasks from the next context begin. This could represent a **barrier synchronization** point or a simple **FIFO (First-In, First-Out) queue** model where kernels are processed to completion in order.
* **Relationship between elements:** The left side represents isolated execution contexts (kernels), each with its own private task queue. The right side represents a unified, global execution queue. The arrow represents the scheduler's action of dequeuing tasks from the individual kernel queues and enqueuing them into the global stream.
* **Notable implications:** The gray coloring of the `Kernel (i+1)` tasks in the output is significant. It may indicate:
* **Lower Priority:** Tasks from the newer kernel are visually de-emphasized, suggesting they are of lower priority or are speculative.
* **Stalling/Dependency:** The system may be stalling the execution of `Kernel (i+1)` tasks until `Kernel (i)` tasks are complete, perhaps due to resource conflicts (e.g., both kernels needing the same `B` resource).
* **Visualization Aid:** It is primarily a visual aid to help the viewer trace the origin of each task in the merged list, confirming the concatenation logic.
* **Underlying principle:** The diagram argues for a simple, predictable, and sequential execution model over more complex interleaved or out-of-order models. It prioritizes clarity and isolation of kernel contexts over potential throughput gains from interleaving. The presence of the same identifier (`B`) in both kernels suggests potential resource contention that this scheduling model may be designed to avoid by serializing access.