## Line Graph: Accuracy vs. Rejection Threshold
### Overview
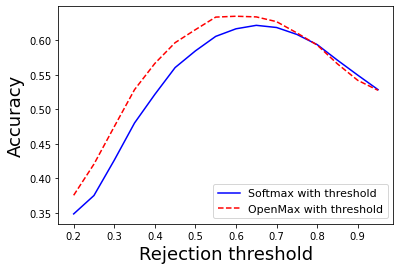
The image is a line graph comparing the accuracy of two classification methods—**Softmax with threshold** and **OpenMax with threshold**—across varying rejection thresholds. The x-axis represents the rejection threshold (0.2 to 0.9), and the y-axis represents accuracy (0.35 to 0.60). Two lines are plotted: a solid blue line for Softmax and a dashed red line for OpenMax.
### Components/Axes
- **X-axis (Rejection threshold)**: Labeled "Rejection threshold," with tick marks at 0.2, 0.3, 0.4, 0.5, 0.6, 0.7, 0.8, and 0.9.
- **Y-axis (Accuracy)**: Labeled "Accuracy," with tick marks at 0.35, 0.40, 0.45, 0.50, 0.55, and 0.60.
- **Legend**: Located in the bottom-right corner, with:
- Solid blue line: "Softmax with threshold"
- Dashed red line: "OpenMax with threshold"
### Detailed Analysis
#### Softmax with threshold (Blue Solid Line)
- **Trend**: Starts at ~0.35 accuracy at a rejection threshold of 0.2, increases steadily to a peak of ~0.62 at 0.6, then declines to ~0.50 at 0.9.
- **Key Data Points**:
- 0.2 → ~0.35
- 0.4 → ~0.45
- 0.6 → ~0.62
- 0.8 → ~0.52
- 0.9 → ~0.50
#### OpenMax with threshold (Red Dashed Line)
- **Trend**: Begins at ~0.38 accuracy at 0.2, rises to a peak of ~0.62 at 0.6, then decreases to ~0.53 at 0.9.
- **Key Data Points**:
- 0.2 → ~0.38
- 0.5 → ~0.58
- 0.6 → ~0.62
- 0.8 → ~0.55
- 0.9 → ~0.53
### Key Observations
1. **Peak Performance**: Both methods achieve maximum accuracy (~0.62) at a rejection threshold of 0.6.
2. **Divergence at Lower Thresholds**: OpenMax starts with higher accuracy than Softmax at thresholds below 0.4.
3. **Convergence at High Thresholds**: The lines converge near 0.9, with both methods showing similar accuracy (~0.50–0.53).
4. **Decline Beyond Optimal Threshold**: Accuracy drops for both methods when the rejection threshold exceeds 0.6.
### Interpretation
The graph demonstrates that both Softmax and OpenMax methods perform optimally at a rejection threshold of 0.6, suggesting this threshold balances accuracy and robustness. Softmax improves more rapidly as the threshold increases from 0.2 to 0.6, while OpenMax maintains higher accuracy in the lower threshold range (0.2–0.4). Beyond 0.6, both methods degrade in performance, with OpenMax retaining a slight edge until 0.9. The convergence at high thresholds implies that extreme rejection (e.g., 0.9) yields comparable but suboptimal results for both approaches. This highlights the importance of tuning the rejection threshold near 0.6 for maximum accuracy, with OpenMax offering marginally better performance in lower-threshold scenarios.