## Bar Chart: Performance Comparison Across Categories
### Overview
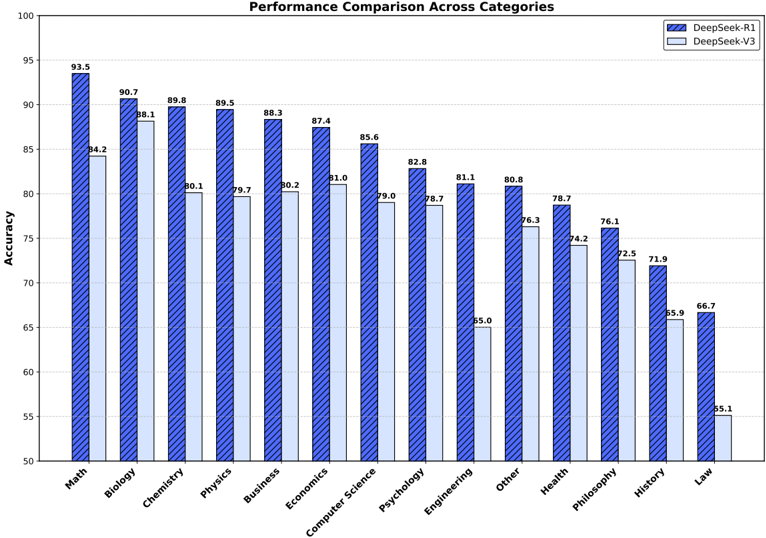
The chart compares the accuracy performance of two models, **DeepSeek-R1** (blue with diagonal stripes) and **DeepSeek-V3** (light blue), across 14 academic and professional categories. Accuracy is measured on a scale from 50 to 100, with R1 consistently outperforming V3 in most categories.
### Components/Axes
- **X-axis (Categories)**: Math, Biology, Chemistry, Physics, Business, Economics, Computer Science, Psychology, Engineering, Other, Health, Philosophy, History, Law.
- **Y-axis (Accuracy)**: Ranges from 50 to 100 in increments of 5.
- **Legend**:
- Blue (diagonal stripes): DeepSeek-R1
- Light blue: DeepSeek-V3
- **Bar Placement**: Each category has two adjacent bars (R1 and V3), with R1 bars positioned slightly higher on the y-axis.
### Detailed Analysis
- **Math**: R1 (93.5) vs. V3 (84.2)
- **Biology**: R1 (90.7) vs. V3 (88.1)
- **Chemistry**: R1 (89.8) vs. V3 (80.1)
- **Physics**: R1 (89.5) vs. V3 (79.7)
- **Business**: R1 (88.3) vs. V3 (80.2)
- **Economics**: R1 (87.4) vs. V3 (81.0)
- **Computer Science**: R1 (85.6) vs. V3 (79.0)
- **Psychology**: R1 (82.8) vs. V3 (78.7)
- **Engineering**: R1 (81.1) vs. V3 (65.0)
- **Other**: R1 (80.8) vs. V3 (76.3)
- **Health**: R1 (78.7) vs. V3 (74.2)
- **Philosophy**: R1 (76.1) vs. V3 (72.5)
- **History**: R1 (71.9) vs. V3 (65.9)
- **Law**: R1 (66.7) vs. V3 (55.1)
### Key Observations
1. **Consistent Outperformance**: R1 exceeds V3 in all categories, with the largest gap in **Math** (93.5 vs. 84.2) and the smallest in **Law** (66.7 vs. 55.1).
2. **Significant Drops for V3**: V3 shows notably lower accuracy in **Engineering** (65.0) and **History** (65.9), suggesting potential weaknesses in these domains.
3. **High-Performance Categories**: Both models excel in **Math**, **Biology**, and **Chemistry**, with R1 maintaining a lead.
4. **Low-Performance Categories**: **Law** is the weakest for both models, with V3 lagging significantly.
### Interpretation
The data indicates that **DeepSeek-R1** is more robust and accurate across disciplines compared to **DeepSeek-V3**, particularly in technical fields like Math and Engineering. The pronounced gap in **Engineering** and **History** for V3 may reflect limitations in training data or model architecture for these domains. The consistent underperformance in **Law** for both models suggests a lack of specialized training in legal reasoning. While R1’s higher accuracy could stem from advanced training techniques or larger datasets, the results highlight the need for targeted improvements in V3 for niche or complex fields.