## Bar Chart: Performance Comparison Across Categories
### Overview
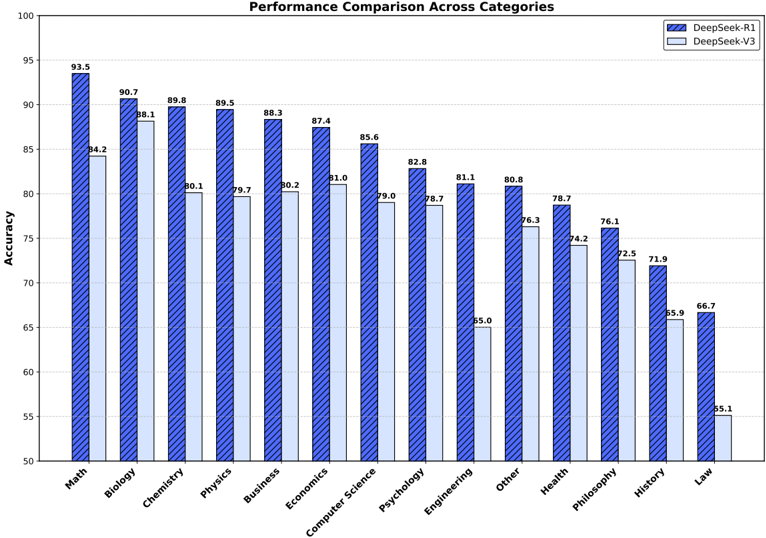
The image is a bar chart comparing the performance (Accuracy) of two models, DeepSeek-R1 and DeepSeek-V3, across various categories (Math, Biology, Chemistry, etc.). The y-axis represents accuracy, ranging from 50 to 100. The x-axis represents the categories. Each category has two bars, one for each model.
### Components/Axes
* **Title:** Performance Comparison Across Categories
* **Y-axis:**
* **Label:** Accuracy
* **Scale:** 50 to 100, with tick marks at intervals of 5.
* **X-axis:**
* **Categories:** Math, Biology, Chemistry, Physics, Business, Economics, Computer Science, Psychology, Engineering, Other, Health, Philosophy, History, Law
* **Legend:** Located at the top-right corner of the chart.
* **DeepSeek-R1:** Represented by solid blue bars with diagonal lines.
* **DeepSeek-V3:** Represented by light blue bars.
### Detailed Analysis
Here's a breakdown of the accuracy for each category and model:
* **Math:**
* DeepSeek-R1: 93.5
* DeepSeek-V3: 84.2
* **Biology:**
* DeepSeek-R1: 90.7
* DeepSeek-V3: 88.1
* **Chemistry:**
* DeepSeek-R1: 89.8
* DeepSeek-V3: 80.1
* **Physics:**
* DeepSeek-R1: 89.5
* DeepSeek-V3: 79.7
* **Business:**
* DeepSeek-R1: 88.3
* DeepSeek-V3: 80.2
* **Economics:**
* DeepSeek-R1: 87.4
* DeepSeek-V3: 81.0
* **Computer Science:**
* DeepSeek-R1: 85.6
* DeepSeek-V3: 79.0
* **Psychology:**
* DeepSeek-R1: 82.8
* DeepSeek-V3: 78.7
* **Engineering:**
* DeepSeek-R1: 81.1
* DeepSeek-V3: 65.0
* **Other:**
* DeepSeek-R1: 80.8
* DeepSeek-V3: 76.3
* **Health:**
* DeepSeek-R1: 78.7
* DeepSeek-V3: 74.2
* **Philosophy:**
* DeepSeek-R1: 76.1
* DeepSeek-V3: 72.5
* **History:**
* DeepSeek-R1: 71.9
* DeepSeek-V3: 55.9
* **Law:**
* DeepSeek-R1: 66.7
* DeepSeek-V3: 55.1
### Key Observations
* DeepSeek-R1 consistently outperforms DeepSeek-V3 across all categories.
* The largest performance difference between the two models is in the "History" category.
* The smallest performance difference between the two models is in the "Biology" category.
* Both models achieve the highest accuracy in "Math" and the lowest in "Law".
### Interpretation
The bar chart provides a clear comparison of the performance of DeepSeek-R1 and DeepSeek-V3 across various academic categories. The data suggests that DeepSeek-R1 is generally more accurate than DeepSeek-V3 in these tasks. The varying performance differences across categories could indicate that the models have different strengths and weaknesses depending on the specific subject matter. The significant drop in accuracy for both models in "Law" might suggest that this category presents unique challenges. The consistent outperformance of DeepSeek-R1 suggests architectural or training improvements over DeepSeek-V3.