## Line Chart: Accuracy vs. Number of Solutions per Problem
### Overview
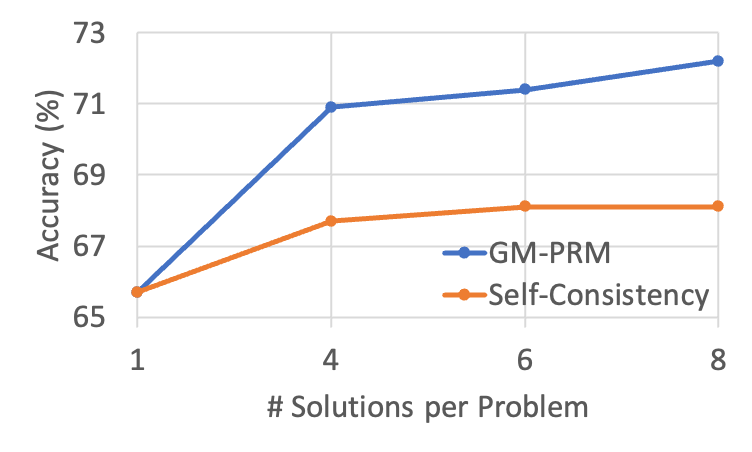
The image displays a line chart comparing the performance of two methods, "GM-PRM" and "Self-Consistency," as the number of solutions generated per problem increases. The chart plots accuracy percentage against the number of solutions, showing how each method's performance scales.
### Components/Axes
* **Chart Type:** Line chart with two data series.
* **X-Axis (Horizontal):** Labeled "# Solutions per Problem". It has discrete markers at values 1, 4, 6, and 8.
* **Y-Axis (Vertical):** Labeled "Accuracy (%)". The scale ranges from 65 to 73, with major gridlines at intervals of 2% (65, 67, 69, 71, 73).
* **Legend:** Located in the bottom-right quadrant of the chart area.
* **Blue line with diamond markers:** Labeled "GM-PRM".
* **Orange line with diamond markers:** Labeled "Self-Consistency".
### Detailed Analysis
**Data Series: GM-PRM (Blue Line)**
* **Trend:** The line shows a strong, positive, and concave-down trend. It rises sharply from 1 to 4 solutions and continues to increase at a slower rate thereafter.
* **Data Points (Approximate):**
* At 1 solution: ~65.7%
* At 4 solutions: ~70.9%
* At 6 solutions: ~71.4%
* At 8 solutions: ~72.2%
**Data Series: Self-Consistency (Orange Line)**
* **Trend:** The line shows a positive trend that plateaus. It rises from 1 to 4 solutions, increases slightly to 6 solutions, and then flattens completely between 6 and 8 solutions.
* **Data Points (Approximate):**
* At 1 solution: ~65.7% (appears to start at the same point as GM-PRM)
* At 4 solutions: ~67.7%
* At 6 solutions: ~68.1%
* At 8 solutions: ~68.1%
### Key Observations
1. **Performance Gap:** A significant performance gap emerges between the two methods as the number of solutions increases. While they start at approximately the same accuracy (~65.7%) with a single solution, GM-PRM consistently outperforms Self-Consistency for 4, 6, and 8 solutions.
2. **Diminishing Returns:** Both methods exhibit diminishing returns. The most substantial accuracy gain for both occurs when moving from 1 to 4 solutions. The rate of improvement slows considerably after that point.
3. **Plateau Effect:** The Self-Consistency method shows a clear performance plateau, with no measurable accuracy gain between 6 and 8 solutions per problem. In contrast, GM-PRM continues to show a slight upward trend in this range.
4. **Maximum Performance:** At the highest measured point (8 solutions), GM-PRM achieves an accuracy of approximately 72.2%, which is about 4.1 percentage points higher than the Self-Consistency method's plateau of ~68.1%.
### Interpretation
The data suggests that the **GM-PRM method is more effective at leveraging additional solution samples to improve final answer accuracy** compared to the Self-Consistency method. The steep initial rise for both indicates that generating multiple solutions is fundamentally beneficial over a single attempt.
However, the diverging trends imply a difference in underlying mechanism or robustness. GM-PRM's continued, albeit slower, improvement suggests its aggregation or selection process (likely a Process Reward Model, given the "PRM" acronym) can still extract useful signal from a larger pool of solutions. The plateau for Self-Consistency indicates that its majority-voting or similar consensus mechanism reaches its maximum effectiveness with around 6 solutions, after which additional samples do not contribute to higher confidence in the correct answer.
For practical application, this chart argues that if computational resources allow for generating 4 or more solutions per problem, **GM-PRM is the superior method for maximizing accuracy**. The cost-benefit analysis would hinge on whether the ~4% accuracy advantage at 8 solutions justifies any potential additional computational overhead of the GM-PRM method over Self-Consistency.