## Diagram: Decision Tree and Neural Network with Explanation
### Overview
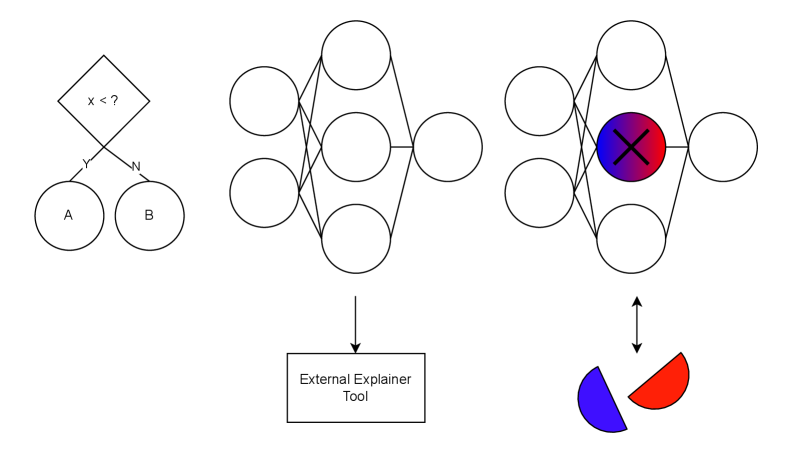
The image depicts a decision tree leading into a neural network, with an "External Explainer Tool" providing insights into the network's decision-making process. The diagram illustrates how a decision made by the tree influences the input to the neural network, and how the network's output can be analyzed.
### Components/Axes
* **Decision Tree (Left):**
* Root Node: A diamond shape containing the text "x < ?".
* Branches: Two branches labeled "Y" (Yes) and "N" (No) leading to two output nodes.
* Output Nodes: Two circles labeled "A" and "B".
* **Neural Network (Center and Right):**
* Input Layer: Three nodes (circles).
* Hidden Layer: Three nodes (circles).
* Output Layer: Three nodes (circles), with the central node colored with a blue-to-red gradient and containing a large "X".
* **External Explainer Tool (Bottom-Center):**
* A rectangular box containing the text "External Explainer Tool".
* An arrow points from the hidden layer of the neural network to this box.
* **Output Representation (Bottom-Right):**
* Two semi-circles, one colored blue and the other red, with a double-headed arrow connecting them to the output layer of the neural network.
### Detailed Analysis
* **Decision Tree:**
* The decision tree starts with a condition "x < ?".
* If the condition is true (Yes), the output is "A".
* If the condition is false (No), the output is "B".
* **Neural Network:**
* The input layer receives input based on the decision tree's output.
* The hidden layer processes the input.
* The output layer produces a result, with the central node highlighted in a blue-to-red gradient and marked with an "X", suggesting a critical or conflicting output.
* **External Explainer Tool:**
* The tool receives information from the hidden layer, indicating it analyzes the internal workings of the neural network.
* **Output Representation:**
* The blue and red semi-circles likely represent the two possible outcomes or classes, with the double-headed arrow suggesting a relationship or mapping between the neural network's output and these outcomes.
### Key Observations
* The diagram combines a decision tree and a neural network, suggesting a hybrid approach to decision-making.
* The "External Explainer Tool" highlights the importance of understanding the neural network's reasoning.
* The colored output node and semi-circles indicate a classification or prediction task.
### Interpretation
The diagram illustrates a system where an initial decision is made by a simple decision tree based on the condition "x < ?". The output of this decision then feeds into a neural network, which performs further processing. The "External Explainer Tool" is used to understand how the neural network arrives at its decision, likely by analyzing the weights and activations of the hidden layer. The final output is represented by two semi-circles, suggesting a binary classification problem where the neural network assigns the input to either the blue or red class. The highlighted output node in the neural network indicates a significant or potentially problematic result, possibly requiring further investigation using the explainer tool.