## Diagram: Decision Tree and Neural Network Architecture with External Explanation Tool
### Overview
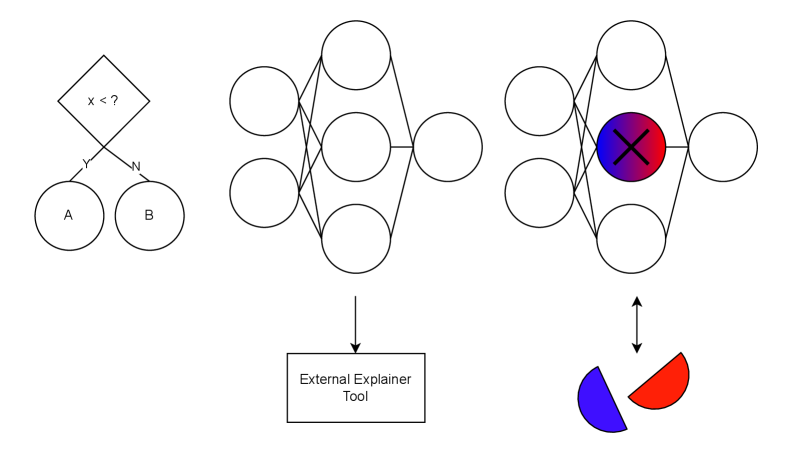
The image contains three interconnected diagrams:
1. A **decision tree** with a binary split based on a condition (`x < ?`).
2. A **complex neural network** with multiple interconnected nodes.
3. A **modified neural network** with a highlighted central node (marked with an "X" and color gradients) and an arrow pointing to a **split visual** (blue and red halves).
An **External Explainer Tool** box connects the second and third diagrams via arrows, suggesting a workflow for analyzing or interpreting the network.
### Components/Axes
#### Diagram 1: Decision Tree
- **Root Node**: Diamond-shaped node labeled `x < ?` (decision point).
- **Branches**:
- Left branch labeled `Y` leading to circle `A`.
- Right branch labeled `N` leading to circle `B`.
- **Leaf Nodes**: Circles `A` and `B` (outcomes).
#### Diagram 2: Neural Network
- **Nodes**: 10 interconnected circles (no explicit labels).
- **Connections**: Dense interconnections between nodes, forming a layered structure.
- **External Tool**: Rectangular box labeled `External Explainer Tool` with an arrow pointing to Diagram 3.
#### Diagram 3: Modified Neural Network
- **Nodes**: Same 10 circles as Diagram 2, but with:
- A **central node** colored in a gradient (blue to red) and marked with a black "X".
- Arrows connecting to a **split visual** (blue and red semicircles) below the network.
- **External Tool**: Arrow from the `External Explainer Tool` box points to the split visual.
### Detailed Analysis
- **Decision Tree**: Represents a binary classification or decision-making process. The condition `x < ?` determines the path to outcomes `A` or `B`.
- **Neural Network**: The dense interconnections suggest a multi-layered architecture (e.g., hidden layers). No explicit labels imply generic nodes (input, hidden, output).
- **Modified Network**: The central "X"-marked node and color gradient (blue to red) likely indicate a critical or anomalous node. The split visual (blue/red halves) may represent a binary output or decision derived from the network’s processing.
- **External Explainer Tool**: Acts as a bridge between the neural network and its interpretation, suggesting a post-hoc analysis workflow.
### Key Observations
1. The decision tree (`Diagram 1`) feeds into the neural network (`Diagram 2`), which is then analyzed by the `External Explainer Tool`.
2. The "X" and color gradient in `Diagram 3` highlight a specific node, possibly indicating its importance or failure in the network.
3. The split visual (blue/red) in `Diagram 3` implies a binary outcome or explanation derived from the network’s processing.
### Interpretation
This diagram illustrates a **decision pipeline**:
1. A condition (`x < ?`) determines an initial path (`A` or `B`).
2. The neural network processes inputs (possibly from `A` or `B`) to generate outputs.
3. The `External Explainer Tool` analyzes the network’s behavior, identifying critical nodes (e.g., the "X"-marked node) and translating results into interpretable outputs (blue/red split).
The color gradient (blue to red) and "X" suggest a focus on node importance or error analysis. The split visual reinforces the idea of binary outcomes or dual-state explanations. The workflow emphasizes transparency in complex systems, using external tools to decode neural network decisions.
No numerical data or trends are present; the diagrams focus on structural relationships and explanatory workflows.