## Energy Landscape Diagram
### Overview
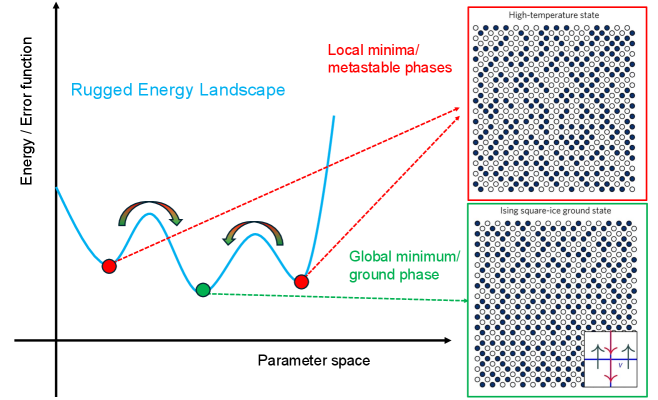
The image depicts an energy landscape diagram illustrating the concept of local minima, global minimum, and their corresponding states. It shows a plot of energy/error function versus parameter space, with a blue line representing the rugged energy landscape. The diagram also includes visual representations of "High-temperature state" and "Ising square-ice ground state" as arrangements of black and white circles.
### Components/Axes
* **Y-axis:** "Energy / Error function"
* **X-axis:** "Parameter space"
* **Blue Line:** "Rugged Energy Landscape"
* **Red Dots:** Represent "Local minima/metastable phases"
* **Green Dot:** Represents "Global minimum/ground phase"
* **Red Box (Top-Right):** "High-temperature state" - A visual representation of a disordered state with alternating black and white circles.
* **Green Box (Bottom-Right):** "Ising square-ice ground state" - A visual representation of an ordered state with a specific arrangement of black and white circles. An inset shows arrows representing the direction of the Ising spins.
### Detailed Analysis or ### Content Details
* **Rugged Energy Landscape (Blue Line):** The blue line shows a curve with multiple local minima and one global minimum. The curve starts at a relatively high energy level, dips down to a local minimum, rises again, dips to a global minimum, rises again, and then dips to another local minimum before rising sharply.
* **Local Minima/Metastable Phases (Red Dots):** Two red dots are placed on the blue line, indicating local minima. These are connected to the "High-temperature state" representation with red dashed lines.
* **Global Minimum/Ground Phase (Green Dot):** A green dot is placed at the lowest point of the blue line, indicating the global minimum. This is connected to the "Ising square-ice ground state" representation with a green dashed line.
* **High-temperature state (Red Box):** The arrangement of black and white circles appears random, suggesting a high-energy, disordered state.
* **Ising square-ice ground state (Green Box):** The arrangement of black and white circles shows a more ordered pattern, suggesting a lower-energy, ordered state. The inset shows arrows pointing up and to the right, labeled 'v', indicating the direction of the Ising spins.
### Key Observations
* The energy landscape has multiple local minima, representing metastable states.
* The global minimum represents the most stable ground state.
* The "High-temperature state" is associated with local minima and a disordered configuration.
* The "Ising square-ice ground state" is associated with the global minimum and an ordered configuration.
### Interpretation
The diagram illustrates the concept of energy landscapes in physical systems. The rugged energy landscape represents the potential energy of a system as a function of its parameters. The local minima correspond to metastable states, where the system can be trapped for a certain period. The global minimum represents the most stable state of the system. The "High-temperature state" and "Ising square-ice ground state" provide visual representations of the system's configuration in different energy states. The diagram suggests that the system tends to settle into the global minimum, but it can be trapped in local minima depending on the initial conditions and energy barriers. The arrows in the Ising square-ice ground state inset likely represent the direction of magnetic spins in the Ising model.