## Diagram: Rugged Energy Landscape and Corresponding Physical States
### Overview
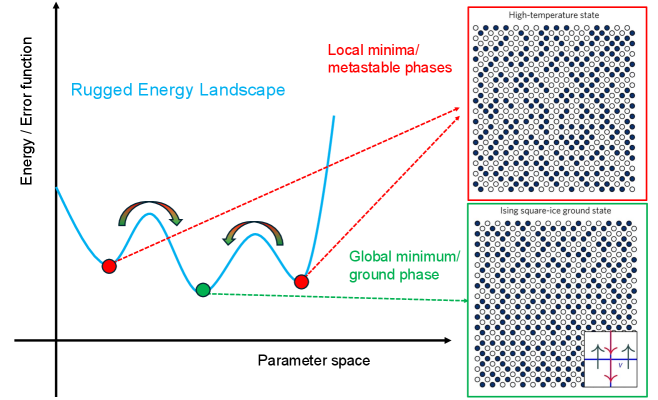
This image is a conceptual scientific diagram illustrating the relationship between a "rugged energy landscape" in parameter space and the corresponding physical states of a system, likely related to statistical mechanics or optimization problems. It combines a 2D graph with two lattice structure diagrams to explain the concepts of local minima (metastable phases) and the global minimum (ground state).
### Components/Axes
**Main Graph (Left Panel):**
* **Y-axis:** Labeled "Energy / Error function". The axis is vertical with an arrow pointing upward, indicating increasing energy or error.
* **X-axis:** Labeled "Parameter space". The axis is horizontal with an arrow pointing to the right, indicating a change in system parameters.
* **Primary Data Series:** A thick, blue, wavy line labeled "Rugged Energy Landscape". This line represents the energy function over the parameter space.
* **Key Points on the Curve:**
* Two **red dots** are placed at the bottom of two separate valleys (local minima) on the blue curve.
* One **green dot** is placed at the bottom of the deepest valley (global minimum) on the blue curve.
* **Annotations:**
* Text "Local minima/metastable phases" in red, positioned in the upper right quadrant of the graph. Two red dashed arrows originate from this text, each pointing to one of the red dots.
* Text "Global minimum/ground phase" in green, positioned below the green dot. A green dashed arrow originates from this text and points to the green dot.
* Two sets of curved, double-headed arrows (brown/green) are drawn over the peaks between the minima, suggesting the possibility of transitions or barriers between states.
**Lattice Diagrams (Right Panel):**
* **Top Diagram (Red Border):**
* **Title:** "High-temperature state" (text above the box).
* **Content:** A square lattice of circles. The circles are a mix of filled (dark blue) and empty (white), arranged in a seemingly random or disordered pattern. This visually represents a high-entropy, disordered phase.
* **Bottom Diagram (Green Border):**
* **Title:** "Ising square-ice ground state" (text above the box).
* **Content:** A square lattice of circles. The circles are arranged in a highly ordered, alternating pattern of filled and empty circles, forming a checkerboard-like structure. This represents an ordered, low-energy ground state.
* **Inset (Bottom-right corner of this diagram):** A small schematic showing a vertex with four arrows. Two arrows point inward (↑ and →) and two point outward (↓ and ←), illustrating the "ice rule" or local constraint for this specific ground state.
### Detailed Analysis
The diagram establishes a direct visual correlation between abstract energy landscape features and concrete physical configurations.
1. **Graph Analysis:** The "Rugged Energy Landscape" (blue line) is non-convex, featuring multiple valleys. The **red dots** mark local minima—points where the system is stable against small perturbations but not the lowest possible energy state. The **green dot** marks the global minimum—the configuration with the absolute lowest energy. The curved arrows over the peaks imply that moving from one minimum to another requires overcoming an energy barrier.
2. **Lattice Correspondence:**
* The **red dots** (local minima) are linked via red dashed arrows to the "High-temperature state" lattice. This indicates that a disordered, high-temperature configuration corresponds to a metastable state in the energy landscape.
* The **green dot** (global minimum) is linked via a green dashed arrow to the "Ising square-ice ground state" lattice. This indicates that the perfectly ordered, low-temperature configuration corresponds to the true ground state of the system.
3. **Spatial Grounding:** The legend (color-coded text and dots) is integrated directly onto the graph. The "High-temperature state" diagram is positioned in the top-right of the overall image, aligned with the "Local minima" annotation. The "Ising square-ice ground state" diagram is in the bottom-right, aligned with the "Global minimum" annotation.
### Key Observations
* **Visual Metaphor:** The diagram effectively uses the "landscape" metaphor common in physics and machine learning, where finding the global minimum is akin to finding the optimal solution.
* **State Dichotomy:** It presents a clear dichotomy between disorder (high-temperature, local minima) and order (ground state, global minimum).
* **Barrier Illustration:** The curved arrows explicitly show that transitions between states are not free but require traversing higher-energy "hills."
* **Specific Model:** The ground state is specified as an "Ising square-ice" state, which is a particular model in statistical physics with local "ice rule" constraints, as shown in the inset.
### Interpretation
This diagram is a pedagogical tool explaining why certain systems can get "stuck" in suboptimal, disordered states (metastable phases) instead of reaching their true, ordered ground state. The "rugged" nature of the energy landscape—with many local minima separated by barriers—makes it difficult for the system to find the global minimum through random thermal fluctuations alone. This concept is fundamental to understanding phenomena like glassy dynamics, protein folding, and the challenges of training complex neural networks (where the "error function" landscape is similarly rugged). The lattices provide a tangible, microscopic picture of what these abstract energy states actually look like: a messy, high-entropy arrangement versus a pristine, low-entropy pattern. The diagram argues that the system's final state depends critically on its ability to navigate this complex landscape.