## Chart/Diagram Type: Rugged Energy Landscape with Phase Transitions
### Overview
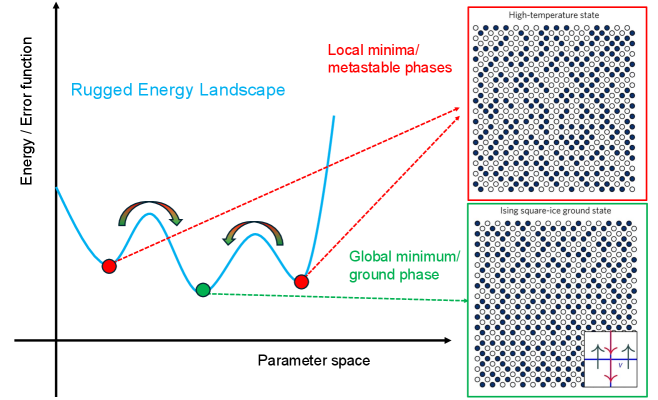
The image depicts a **rugged energy landscape** (blue line) plotted against **parameter space** (x-axis) and **Energy / Error function** (y-axis). It includes two insets showing **high-temperature states** (disordered lattice) and **ground states** (ordered lattice). Red and green dots mark critical points, with red dashed lines connecting metastable phases to the global minimum.
### Components/Axes
- **X-axis**: Parameter space (no numerical scale provided).
- **Y-axis**: Energy / Error function (no numerical scale provided).
- **Legend**:
- Red dashed lines: "Local minima/metastable phases"
- Green dashed line: "Global minimum/ground phase"
- **Insets**:
- Top-right: "High-temperature state" (disordered lattice of blue/white dots).
- Bottom-right: "Ising square-ice ground state" (ordered lattice with arrows indicating spin interactions).
### Detailed Analysis
1. **Rugged Energy Landscape (Blue Line)**:
- The blue line oscillates with three peaks and two valleys.
- **Local minima**: Two red dots at parameter space positions ~0.3 and ~0.7 (approximate).
- **Global minimum**: Green dot at parameter space position ~0.5 (approximate).
- Red dashed lines connect local minima to the global minimum, illustrating transitions between metastable and stable states.
2. **High-Temperature State (Top Inset)**:
- Disordered lattice of blue and white dots (no discernible pattern).
- Arrows in the inset (bottom-right corner) show random spin orientations (red/blue arrows).
3. **Ground State (Bottom Inset)**:
- Ordered lattice with alternating blue and white dots.
- Arrows in the inset show coordinated spin interactions (red/blue arrows forming a cross pattern).
### Key Observations
- The energy landscape has **two metastable states** (local minima) and one **global minimum** (green dot).
- The **global minimum** is positioned centrally in parameter space (~0.5), while local minima are offset (~0.3 and ~0.7).
- The **high-temperature state** lacks order, while the **ground state** exhibits a highly structured lattice.
- Red dashed lines suggest **phase transitions** between metastable and ground states.
### Interpretation
This diagram likely represents a **phase transition model** (e.g., Ising model) in physics or materials science. The rugged energy landscape illustrates how systems navigate between metastable states (local minima) and the most stable state (global minimum). The insets visualize the **disordered-to-ordered transition** driven by temperature changes:
- At high temperatures, thermal energy disrupts order (high-temperature state).
- At low temperatures, spins align to minimize energy (ground state).
The diagram emphasizes the **challenge of escaping local minima** in optimization problems, a common issue in machine learning and statistical mechanics. The Ising square-ice ground state inset suggests a focus on **frustration-free systems** with exact solvability.
No numerical values or uncertainties are provided in the image. All positional estimates (e.g., parameter space positions) are approximate based on visual alignment.