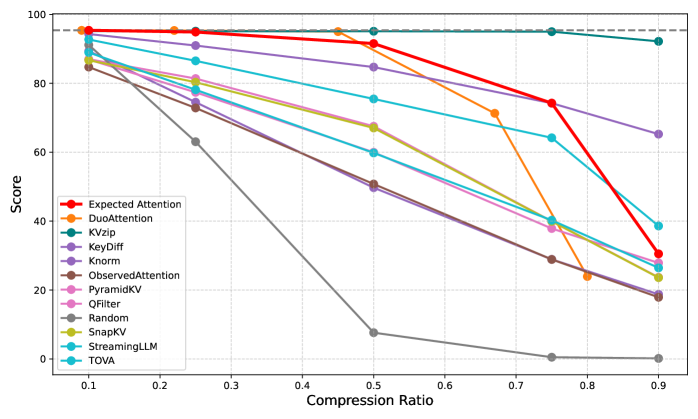
## Line Chart: Performance of Compression Methods Across Compression Ratios
### Overview
The chart compares the performance scores of 10 compression methods (e.g., KVzip, KeyDiff, SnapKV) across compression ratios ranging from 0.1 to 0.9. Scores are plotted on a 0–100 scale, with higher values indicating better performance. The red dashed line at 100 represents a theoretical maximum score.
### Components/Axes
- **X-axis (Compression Ratio)**: Labeled "Compression Ratio" with ticks at 0.1, 0.2, ..., 0.9.
- **Y-axis (Score)**: Labeled "Score" with ticks at 0, 20, ..., 100.
- **Legend**: Located in the bottom-left corner, mapping colors to methods:
- Red: Expected Attention
- Orange: DuoAttention
- Teal: KVzip
- Purple: KeyDiff
- Dark Purple: Knorm
- Brown: Observed Attention
- Pink: PyramidKV
- Gray: QFilter
- Olive: Random
- Yellow: SnapKV
- Cyan: StreamingLLM
- Blue: TOVA
### Detailed Analysis
1. **Expected Attention (Red)**: Starts near 100 at 0.1, declines sharply after 0.7, ending at ~30 at 0.9.
2. **DuoAttention (Orange)**: Peaks at ~95 at 0.4, then drops to ~20 at 0.9.
3. **KVzip (Teal)**: Maintains ~95–100 across all ratios.
4. **KeyDiff (Purple)**: Gradual decline from ~90 at 0.1 to ~65 at 0.9.
5. **Knorm (Dark Purple)**: Steady decline from ~90 at 0.1 to ~20 at 0.9.
6. **Observed Attention (Brown)**: Sharp drop from ~85 at 0.1 to ~15 at 0.9.
7. **PyramidKV (Pink)**: Gradual decline from ~85 at 0.1 to ~25 at 0.9.
8. **QFilter (Gray)**: Steep decline from ~90 at 0.1 to ~5 at 0.9.
9. **Random (Olive)**: Plummets from ~85 at 0.1 to ~0 at 0.5, then plateaus near 0.
10. **SnapKV (Yellow)**: Declines from ~85 at 0.1 to ~25 at 0.9.
11. **StreamingLLM (Cyan)**: Gradual decline from ~90 at 0.1 to ~30 at 0.9.
12. **TOVA (Blue)**: Steady decline from ~90 at 0.1 to ~25 at 0.9.
### Key Observations
- **KVzip (Teal)** consistently outperforms all methods, maintaining near-maximum scores.
- **Random (Olive)** and **QFilter (Gray)** show the steepest declines, with Random collapsing entirely after 0.5.
- **Expected Attention (Red)** and **Observed Attention (Brown)** exhibit abrupt drops post-0.7, suggesting sensitivity to higher compression.
- **DuoAttention (Orange)** and **SnapKV (Yellow)** have non-linear trends, peaking at mid-range ratios before declining.
- **Knorm (Dark Purple)** and **TOVA (Blue)** show linear degradation with increasing compression.
### Interpretation
The data highlights **KVzip** as the most robust method, maintaining high performance even at extreme compression ratios. Methods like **Random** and **QFilter** are highly inefficient, failing catastrophically as compression increases. The sharp declines in **Expected Attention** and **Observed Attention** suggest these methods prioritize accuracy over compression efficiency, while others (e.g., **KeyDiff**, **StreamingLLM**) balance both. The divergence in trends implies trade-offs between compression ratio and performance, with no single method dominating across all ratios. Notably, **DuoAttention** and **SnapKV** achieve peak performance at mid-range ratios (~0.4–0.5), indicating optimal trade-offs for specific use cases.