## Line Chart: Probability vs. Number of Heads Disabled
### Overview
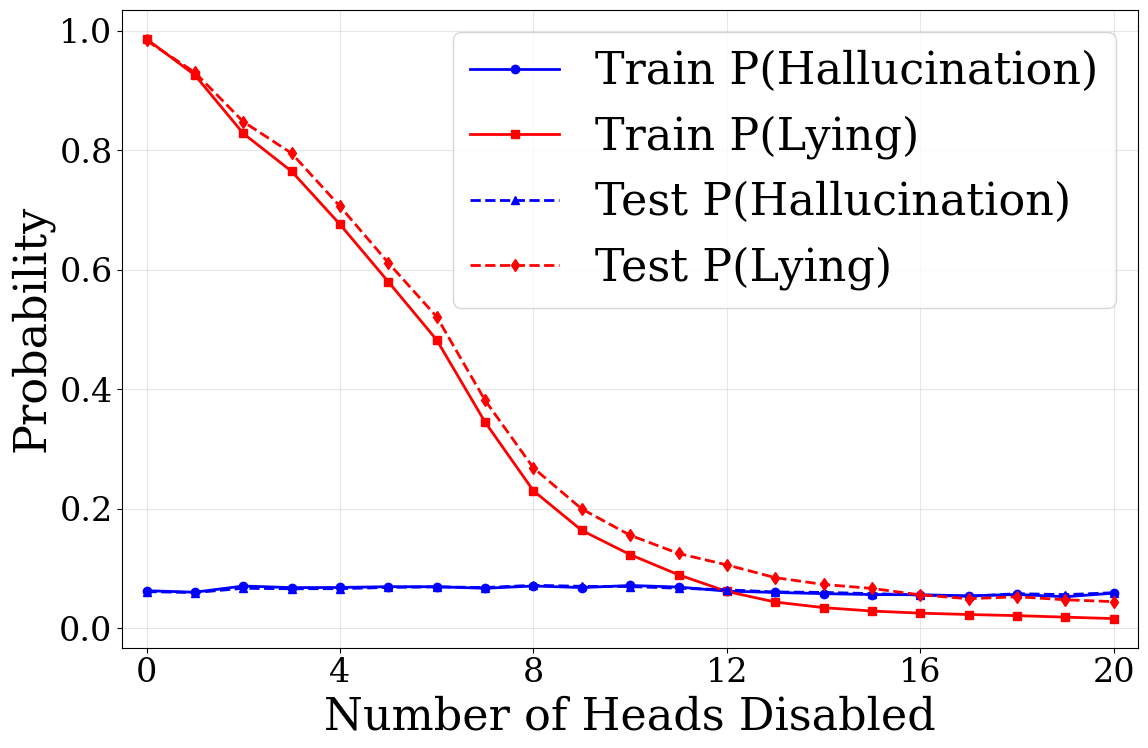
The image is a line chart that plots the probability of hallucination and lying against the number of heads disabled. There are four data series: Train P(Hallucination), Train P(Lying), Test P(Hallucination), and Test P(Lying). The x-axis represents the number of heads disabled, ranging from 0 to 20. The y-axis represents the probability, ranging from 0.0 to 1.0.
### Components/Axes
* **X-axis:** Number of Heads Disabled, ranging from 0 to 20 in increments of 4.
* **Y-axis:** Probability, ranging from 0.0 to 1.0 in increments of 0.2.
* **Legend (Top-Right):**
* Blue solid line with circle markers: Train P(Hallucination)
* Red solid line with square markers: Train P(Lying)
* Blue dashed line with triangle markers: Test P(Hallucination)
* Red dashed line with diamond markers: Test P(Lying)
### Detailed Analysis
* **Train P(Hallucination) (Blue solid line with circle markers):** This line remains relatively flat and low across the entire range of the x-axis. The probability starts at approximately 0.06 at 0 heads disabled and fluctuates slightly, ending at approximately 0.05 at 20 heads disabled.
* **Train P(Lying) (Red solid line with square markers):** This line starts at a high probability of approximately 0.98 at 0 heads disabled and decreases sharply until around 12 heads disabled, where it plateaus. At 12 heads disabled, the probability is approximately 0.06, and it ends at approximately 0.01 at 20 heads disabled.
* **Test P(Hallucination) (Blue dashed line with triangle markers):** This line is similar to Train P(Hallucination), remaining relatively flat and low. It starts at approximately 0.06 at 0 heads disabled and ends at approximately 0.06 at 20 heads disabled.
* **Test P(Lying) (Red dashed line with diamond markers):** This line follows a similar trend to Train P(Lying), starting high and decreasing sharply. It starts at approximately 0.99 at 0 heads disabled and decreases to approximately 0.07 at 12 heads disabled, ending at approximately 0.04 at 20 heads disabled.
**Specific Data Points (Approximate):**
| Heads Disabled | Train P(Hallucination) | Train P(Lying) | Test P(Hallucination) | Test P(Lying) |
|----------------|------------------------|----------------|-----------------------|---------------|
| 0 | 0.06 | 0.98 | 0.06 | 0.99 |
| 4 | 0.07 | 0.72 | 0.07 | 0.78 |
| 8 | 0.07 | 0.25 | 0.07 | 0.30 |
| 12 | 0.06 | 0.06 | 0.07 | 0.07 |
| 16 | 0.05 | 0.02 | 0.05 | 0.05 |
| 20 | 0.05 | 0.01 | 0.06 | 0.04 |
### Key Observations
* The probability of lying decreases significantly as the number of heads disabled increases for both training and testing data.
* The probability of hallucination remains relatively constant and low regardless of the number of heads disabled for both training and testing data.
* The training and testing data for both lying and hallucination follow similar trends.
* The probability of lying drops sharply between 0 and 12 disabled heads, then plateaus.
### Interpretation
The data suggests that disabling heads in the model significantly reduces the probability of lying, while having little to no effect on the probability of hallucination. This could indicate that the "lying" behavior is more dependent on specific heads within the model, and disabling these heads effectively mitigates this behavior. The consistent probability of hallucination, regardless of the number of heads disabled, suggests that this behavior is either more distributed across the model or is not significantly impacted by the specific heads being disabled. The similarity between training and testing data suggests that the model generalizes well to unseen data in terms of these probabilities. The sharp drop in lying probability followed by a plateau indicates that there may be a critical number of heads that, when disabled, significantly reduce the likelihood of lying, after which further disabling has minimal impact.