# Technical Data Extraction: Probability vs. Number of Heads Disabled
## 1. Image Overview
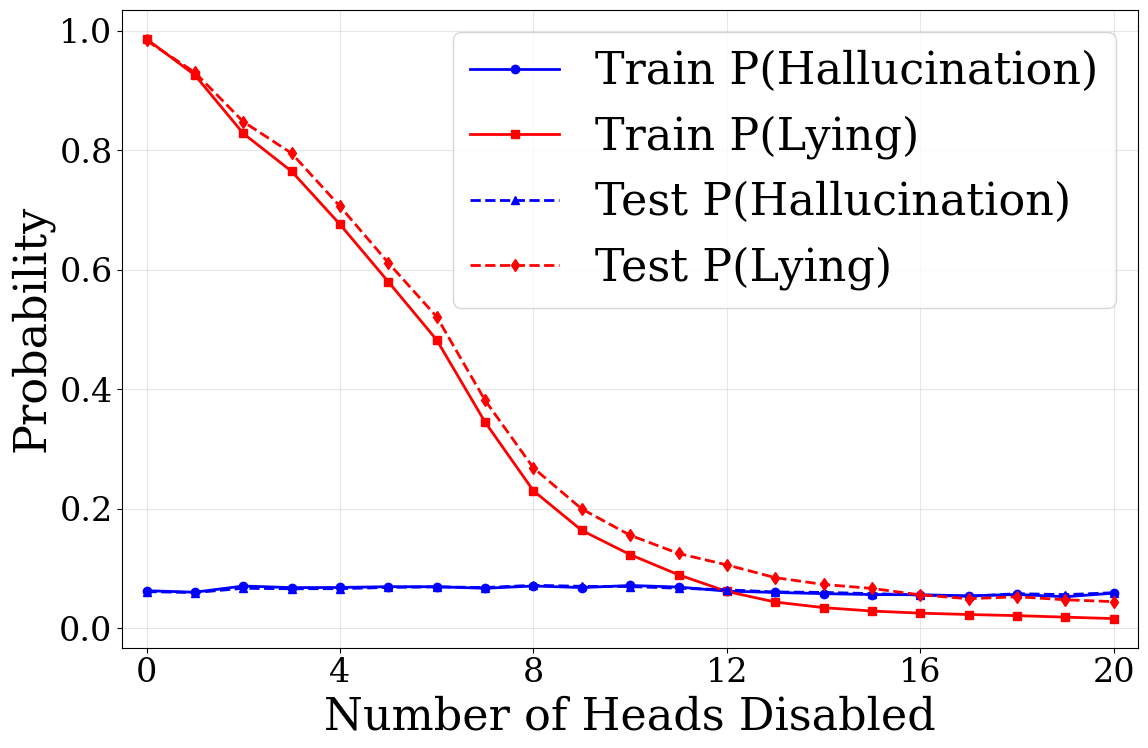
This image is a line graph illustrating the relationship between the number of attention heads disabled in a model and the resulting probability of two specific behaviors: "Hallucination" and "Lying." The data is segmented into "Train" and "Test" sets for each behavior.
## 2. Component Isolation
### A. Header/Legend
* **Location:** Top-right quadrant of the chart area.
* **Content:**
* **Blue Solid Line with Circle Markers:** `Train P(Hallucination)`
* **Red Solid Line with Square Markers:** `Train P(Lying)`
* **Blue Dashed Line with Triangle Markers:** `Test P(Hallucination)`
* **Red Dashed Line with Diamond Markers:** `Test P(Lying)`
### B. Main Chart Area (Axes)
* **Y-Axis Label:** `Probability`
* **Y-Axis Scale:** Linear, ranging from `0.0` to `1.0` with major tick marks every `0.2`.
* **X-Axis Label:** `Number of Heads Disabled`
* **X-Axis Scale:** Linear, ranging from `0` to `20` with major tick marks every `4` units (`0, 4, 8, 12, 16, 20`). Minor grid lines appear every 1 unit.
## 3. Trend Verification and Data Extraction
### Series 1: Train P(Hallucination) (Blue Solid Line, Circles)
* **Visual Trend:** This line remains nearly horizontal and stable across the entire x-axis range, maintaining a very low probability.
* **Key Data Points (Approximate):**
* x=0: ~0.06
* x=10: ~0.07
* x=20: ~0.06
### Series 2: Test P(Hallucination) (Blue Dashed Line, Triangles)
* **Visual Trend:** This line closely tracks the `Train P(Hallucination)` series, showing a stable, low probability with minor fluctuations.
* **Key Data Points (Approximate):**
* x=0: ~0.06
* x=10: ~0.07
* x=20: ~0.06
### Series 3: Train P(Lying) (Red Solid Line, Squares)
* **Visual Trend:** This line starts at a very high probability (~1.0) and exhibits a sharp, non-linear decrease (sigmoidal/exponential decay) as more heads are disabled. It eventually plateaus near zero.
* **Key Data Points (Approximate):**
* x=0: ~0.98
* x=4: ~0.68
* x=8: ~0.23
* x=12: ~0.06
* x=16: ~0.03
* x=20: ~0.02
### Series 4: Test P(Lying) (Red Dashed Line, Diamonds)
* **Visual Trend:** Similar to the training set, this line starts high and decreases sharply. However, it consistently maintains a slightly higher probability than the training line throughout the descent, indicating a small generalization gap.
* **Key Data Points (Approximate):**
* x=0: ~0.98
* x=4: ~0.71
* x=8: ~0.27
* x=12: ~0.11
* x=16: ~0.06
* x=20: ~0.04
## 4. Summary of Findings
* **Behavioral Impact:** Disabling attention heads has a profound impact on the "Lying" behavior, reducing its probability from near-certainty to near-zero over the course of 20 disabled heads.
* **Invariance:** The "Hallucination" behavior appears largely unaffected by the disabling of these specific heads, remaining constant at a low baseline probability (~0.06).
* **Train/Test Consistency:** There is high alignment between training and testing data for both metrics, though the "Lying" behavior shows a slightly higher persistence in the test set as heads are disabled.
* **Intersection:** At approximately x=12, the probability of "Lying" (Train) drops below the baseline probability of "Hallucination."