## Line Chart: 8x8 Gridworld: Success vs Optimal Rate
### Overview
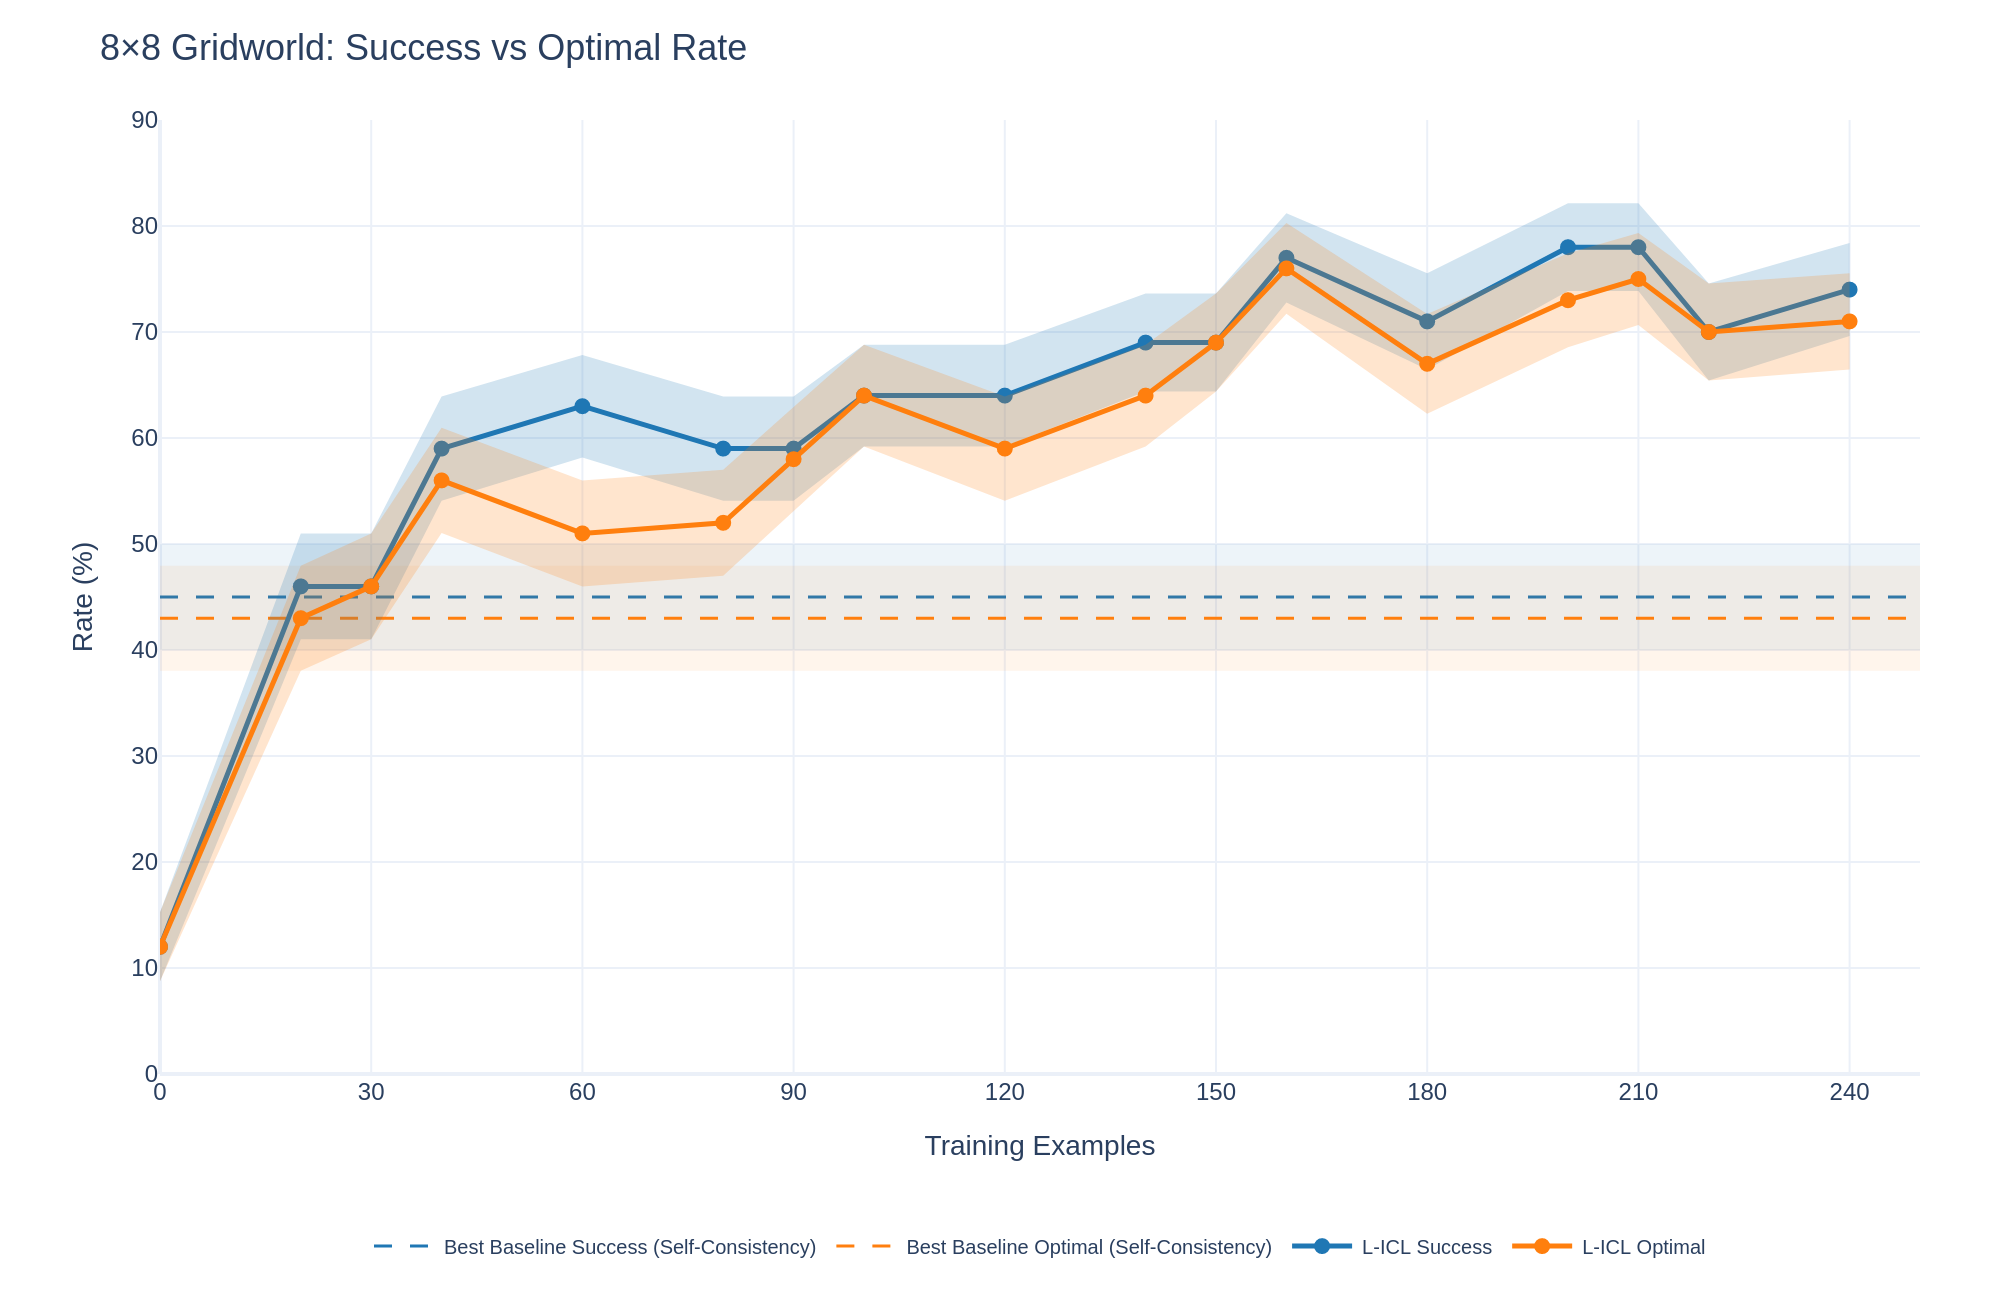
The image is a line chart comparing the success rate and optimal rate of two methods, "Best Baseline" and "L-ICL," across varying numbers of training examples in an 8x8 Gridworld environment. The chart displays the performance of each method, along with shaded regions indicating variability or confidence intervals.
### Components/Axes
* **Title:** 8x8 Gridworld: Success vs Optimal Rate
* **X-axis:** Training Examples, with markers at 0, 30, 60, 90, 120, 150, 180, 210, and 240.
* **Y-axis:** Rate (%), with markers at 0, 10, 20, 30, 40, 50, 60, 70, 80, and 90.
* **Legend:** Located at the bottom of the chart.
* Best Baseline Success (Self-Consistency) - Dashed Blue Line
* Best Baseline Optimal (Self-Consistency) - Dashed Orange Line
* L-ICL Success - Solid Blue Line
* L-ICL Optimal - Solid Orange Line
### Detailed Analysis
* **Best Baseline Success (Self-Consistency):** Represented by a dashed blue line. The line is approximately flat at a rate of 45%.
* **Best Baseline Optimal (Self-Consistency):** Represented by a dashed orange line. The line is approximately flat at a rate of 45%.
* **L-ICL Success:** Represented by a solid blue line.
* Starts at approximately 10% at 0 Training Examples.
* Rises sharply to approximately 46% at 30 Training Examples.
* Increases to approximately 63% at 60 Training Examples.
* Decreases slightly to approximately 59% at 90 Training Examples.
* Increases to approximately 63% at 120 Training Examples.
* Increases to approximately 69% at 150 Training Examples.
* Increases to approximately 77% at 180 Training Examples.
* Decreases slightly to approximately 73% at 210 Training Examples.
* Increases to approximately 74% at 240 Training Examples.
* **L-ICL Optimal:** Represented by a solid orange line.
* Starts at approximately 10% at 0 Training Examples.
* Rises sharply to approximately 46% at 30 Training Examples.
* Decreases slightly to approximately 51% at 60 Training Examples.
* Increases to approximately 63% at 90 Training Examples.
* Increases to approximately 65% at 120 Training Examples.
* Increases to approximately 69% at 150 Training Examples.
* Decreases to approximately 67% at 180 Training Examples.
* Increases to approximately 78% at 210 Training Examples.
* Decreases slightly to approximately 71% at 240 Training Examples.
### Key Observations
* The "Best Baseline" methods (both Success and Optimal) remain relatively constant across all training examples, hovering around 45%.
* The "L-ICL" methods (both Success and Optimal) show a significant increase in rate as the number of training examples increases, particularly in the early stages.
* The "L-ICL Success" rate is generally higher than the "L-ICL Optimal" rate, especially after 60 training examples.
* Both "L-ICL" lines show some fluctuation, but generally trend upwards.
### Interpretation
The data suggests that the "L-ICL" methods are more effective than the "Best Baseline" methods in the 8x8 Gridworld environment, as they achieve higher success and optimal rates with increasing training examples. The "Best Baseline" methods appear to have a fixed performance level, regardless of the number of training examples. The fluctuations in the "L-ICL" lines could be due to the learning process, where the model adjusts its strategy based on the training data. The shaded regions around the lines likely represent the variance in the results across multiple runs or experiments, indicating the reliability of the observed trends.