## Line Chart: 8x8 Gridworld: Success vs Optimal Rate
### Overview
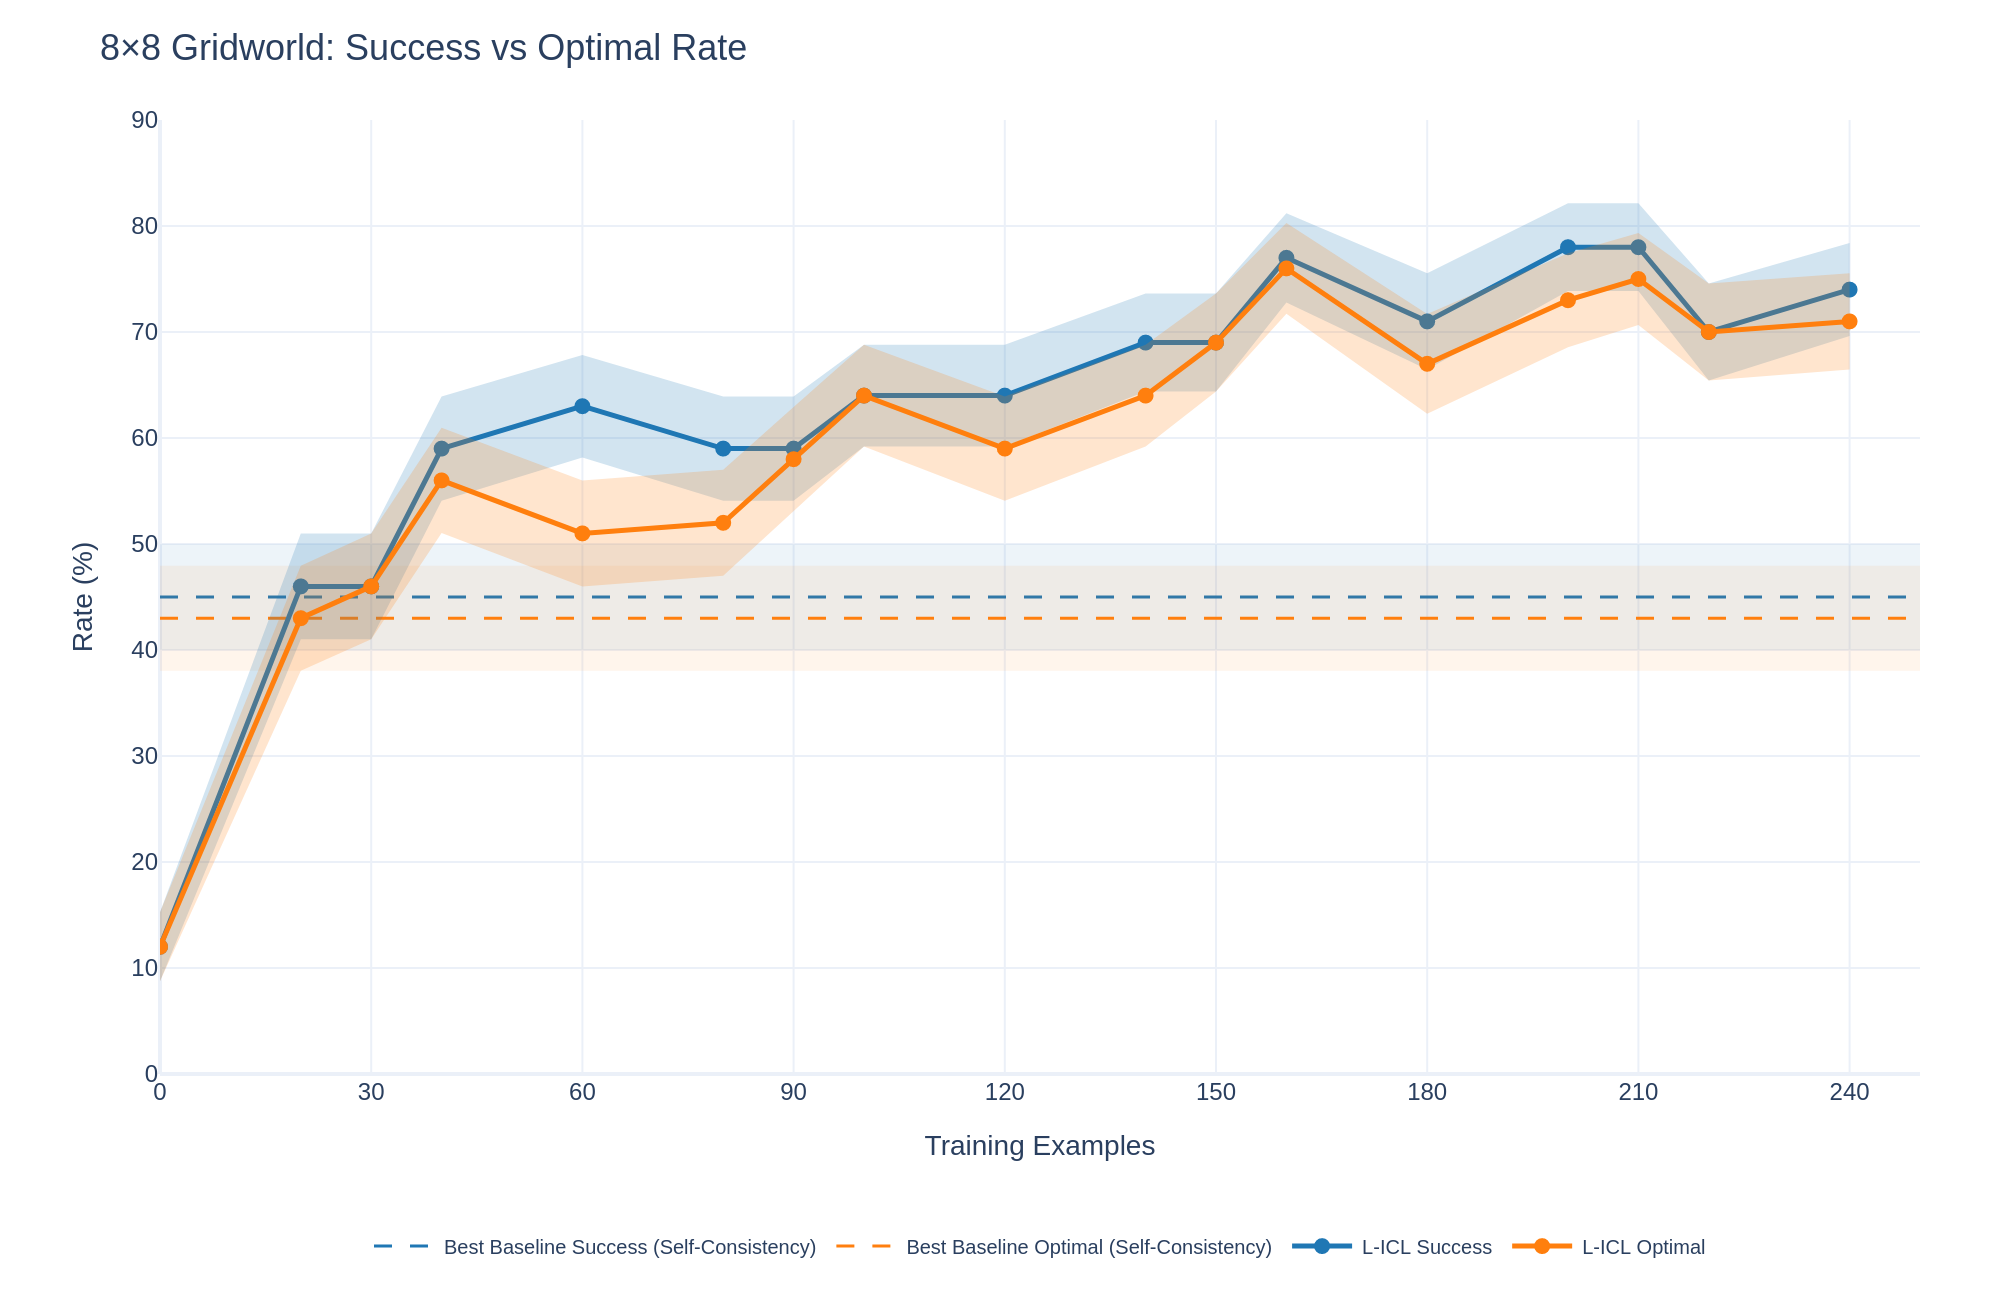
This line chart compares the success rate and optimal rate in an 8x8 Gridworld environment as a function of the number of training examples. The chart displays two main lines representing the success and optimal rates, along with shaded areas indicating the lower and upper confidence intervals (L-ICL). Two dashed lines represent the baseline success and optimal rates.
### Components/Axes
* **Title:** 8x8 Gridworld: Success vs Optimal Rate
* **X-axis:** Training Examples (Scale: 0 to 240, increments of 30)
* **Y-axis:** Rate (%) (Scale: 0 to 90, increments of 10)
* **Legend:** Located at the bottom-center of the chart.
* Best Baseline Success (Self-Consistency) - Dashed Orange Line
* Best Baseline Optimal (Self-Consistency) - Dashed Blue Line
* L-ICL Success - Blue Line with Shaded Area
* L-ICL Optimal - Orange Line with Shaded Area
### Detailed Analysis
The chart shows the following trends and data points:
* **Best Baseline Success (Self-Consistency):** This is a horizontal dashed orange line. It remains relatively constant at approximately 44% throughout the range of training examples.
* **Best Baseline Optimal (Self-Consistency):** This is a horizontal dashed blue line. It remains relatively constant at approximately 42% throughout the range of training examples.
* **L-ICL Success (Blue Line):** This line starts at approximately 44% at 0 training examples. It decreases to around 30% at 30 training examples, then increases, reaching a peak of approximately 75% at 150 training examples. It then fluctuates, ending at approximately 72% at 240 training examples.
* **L-ICL Optimal (Orange Line):** This line starts at approximately 42% at 0 training examples. It decreases sharply to around 25% at 30 training examples, then increases, reaching a peak of approximately 72% at 150 training examples. It then fluctuates, ending at approximately 70% at 240 training examples.
* **L-ICL Success Shaded Area:** The shaded area around the blue line represents the lower and upper confidence intervals. The width of the shaded area varies, indicating the uncertainty in the success rate.
* **L-ICL Optimal Shaded Area:** The shaded area around the orange line represents the lower and upper confidence intervals. The width of the shaded area varies, indicating the uncertainty in the optimal rate.
Here's a more detailed breakdown of approximate values at specific training example points:
| Training Examples | L-ICL Success (%) | L-ICL Optimal (%) |
|---|---|---|
| 0 | 44 | 42 |
| 30 | 30 | 25 |
| 60 | 58 | 52 |
| 90 | 62 | 58 |
| 120 | 68 | 64 |
| 150 | 75 | 72 |
| 180 | 70 | 66 |
| 210 | 73 | 68 |
| 240 | 72 | 70 |
### Key Observations
* Both the success and optimal rates initially decrease with a small number of training examples (0-30).
* Both rates increase significantly between 30 and 150 training examples, suggesting a learning phase.
* After 150 training examples, the rates fluctuate but generally remain high.
* The success rate (blue line) is consistently slightly higher than the optimal rate (orange line) after approximately 60 training examples.
* The confidence intervals (shaded areas) are wider at the beginning and end of the training period, indicating greater uncertainty.
### Interpretation
The data suggests that the agent's performance (both success and optimal rates) in the 8x8 Gridworld environment improves with more training examples. The initial decrease in performance may be due to the agent exploring the environment and learning the basic dynamics. The subsequent increase indicates that the agent is learning to navigate and achieve its goals more effectively. The fact that the success rate is consistently higher than the optimal rate after a certain point suggests that the agent is not only finding optimal solutions but also succeeding in other, potentially suboptimal, ways. The confidence intervals provide a measure of the reliability of the results, indicating that the performance is more consistent with a larger number of training examples. The baseline rates are relatively low, indicating that the self-consistency method provides a significant improvement in performance. The fluctuations in the rates after 150 training examples could be due to the complexity of the environment or the stochastic nature of the learning process.