## Line Chart: 8x8 Gridworld: Success vs Optimal Rate
### Overview
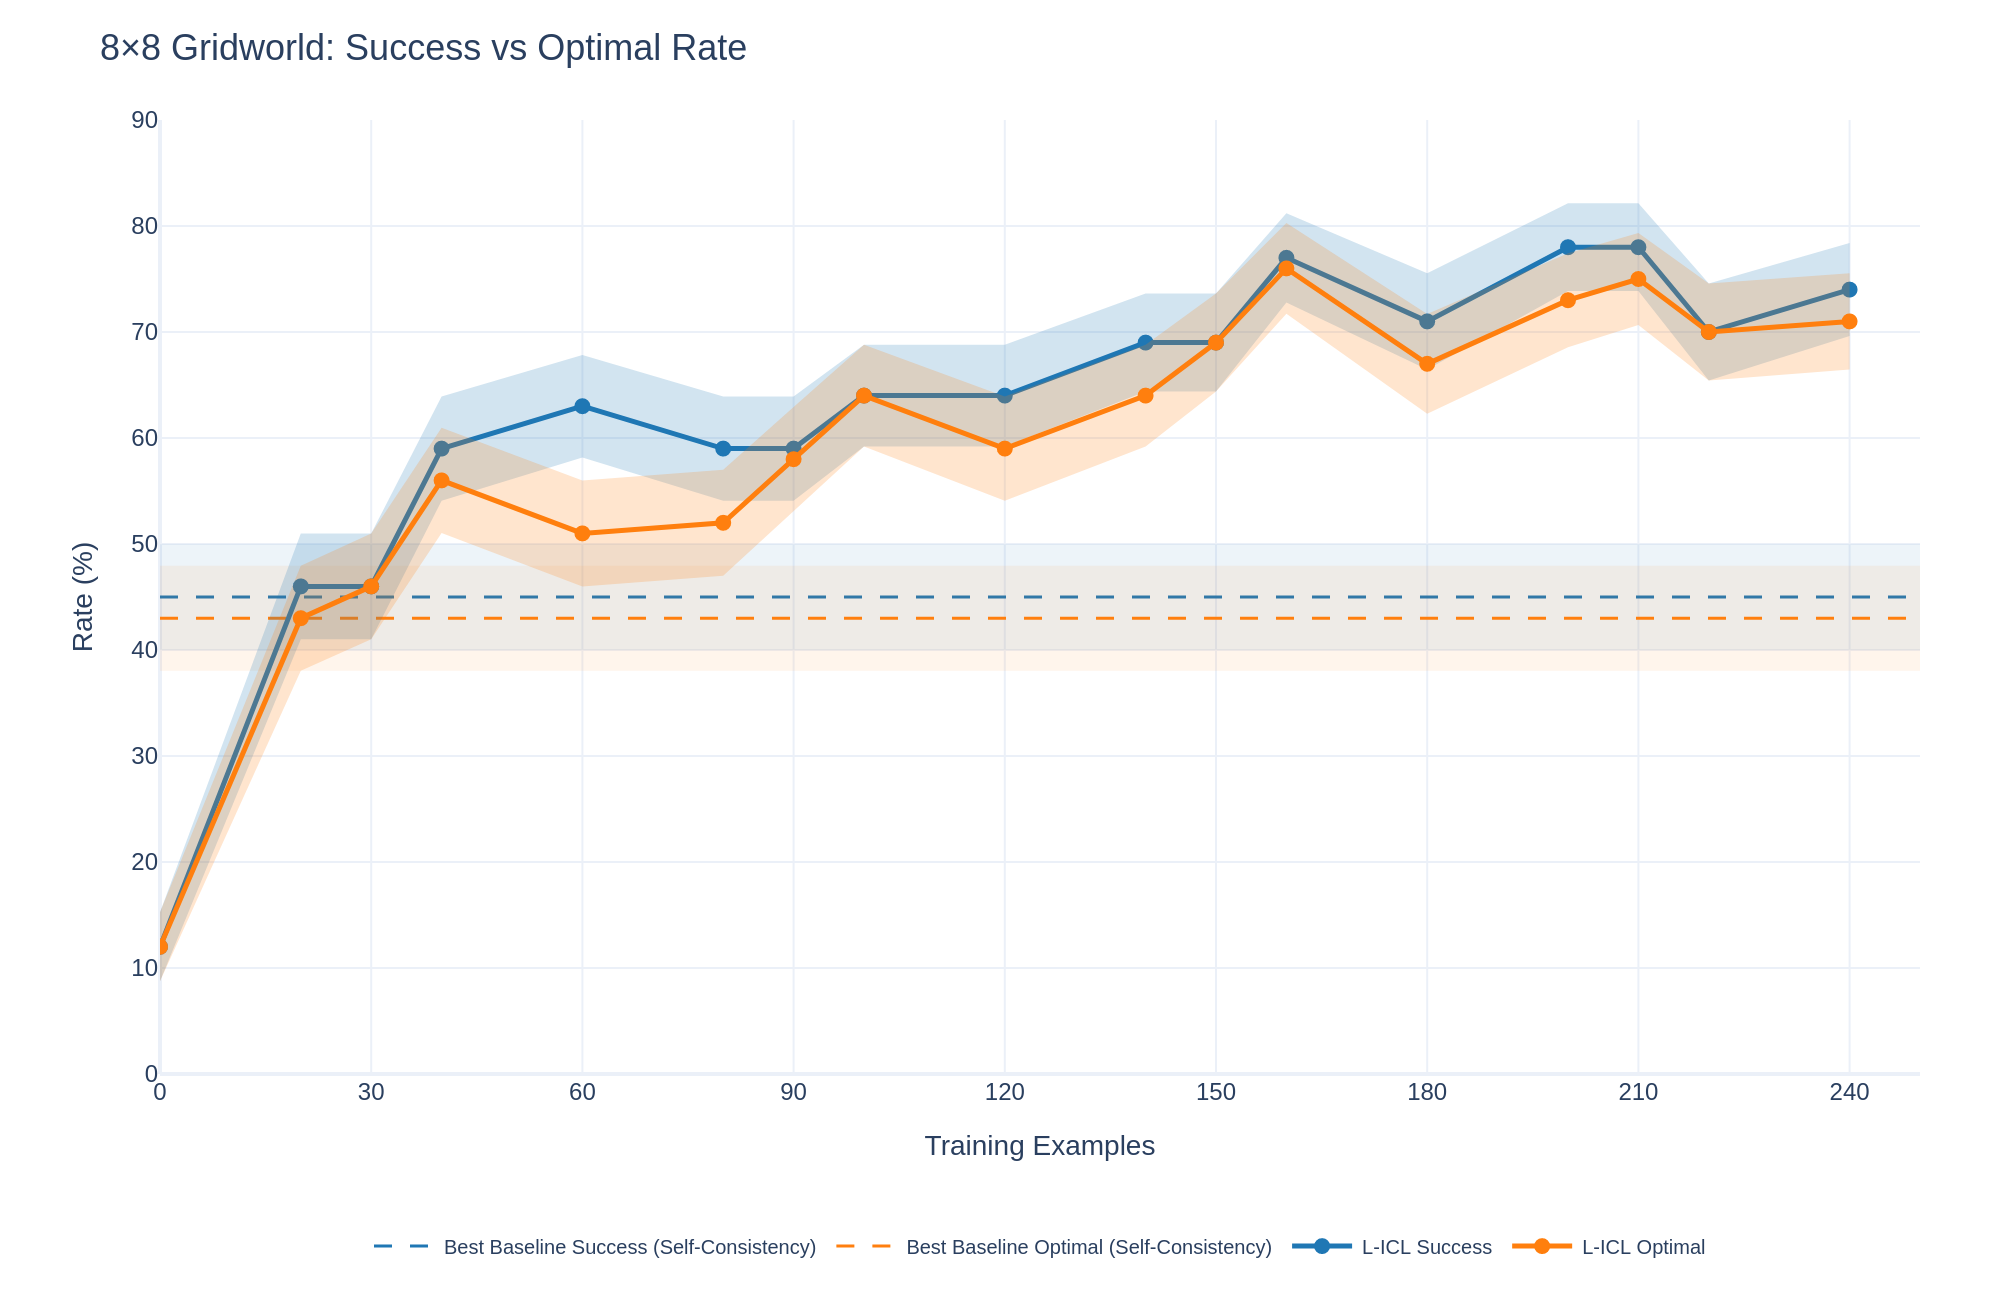
The chart compares the performance of two methods ("Best Baseline" and "L-ICL") across two metrics ("Success" and "Optimal Rate") as training examples increase from 0 to 240. Performance is measured as a percentage rate, with shaded regions indicating confidence intervals.
### Components/Axes
- **X-axis**: Training Examples (0–240, increments of 30)
- **Y-axis**: Rate (%) (0–90, increments of 10)
- **Legend**:
- Dashed Blue: Best Baseline Success
- Dashed Orange: Best Baseline Optimal
- Solid Blue: L-ICL Success
- Solid Orange: L-ICL Optimal
- **Shaded Regions**: Confidence intervals (wider for L-ICL lines)
### Detailed Analysis
1. **Best Baseline Success (Dashed Blue)**:
- Starts at ~10% at 0 training examples.
- Peaks at ~60% at 60 examples.
- Fluctuates between ~50–70% up to 240 examples.
- Confidence interval widens slightly after 60 examples.
2. **Best Baseline Optimal (Dashed Orange)**:
- Starts at ~5% at 0 training examples.
- Peaks at ~55% at 60 examples.
- Fluctuates between ~40–65% up to 240 examples.
- Confidence interval remains narrow throughout.
3. **L-ICL Success (Solid Blue)**:
- Starts at ~10% at 0 training examples.
- Peaks at ~75% at 160 examples.
- Dips to ~70% at 240 examples.
- Confidence interval widens significantly after 60 examples.
4. **L-ICL Optimal (Solid Orange)**:
- Starts at ~5% at 0 training examples.
- Peaks at ~70% at 160 examples.
- Dips to ~70% at 240 examples.
- Confidence interval widens significantly after 60 examples.
### Key Observations
- **Performance Trends**:
- L-ICL methods outperform Best Baseline in both metrics after ~90 training examples.
- L-ICL Success achieves the highest peak (~75%) but shows higher variability.
- L-ICL Optimal maintains a narrower confidence interval despite lower peak performance (~70%).
- **Crossovers**:
- L-ICL Success surpasses Best Baseline Success after ~90 examples.
- L-ICL Optimal overtakes Best Baseline Optimal after ~60 examples.
- **Confidence Intervals**:
- L-ICL methods exhibit greater uncertainty (wider shaded regions) compared to Best Baseline.
### Interpretation
The data suggests that L-ICL methods are more effective in the 8x8 Gridworld task as training examples increase, particularly for the "Success" metric. However, their higher confidence intervals indicate less consistency compared to Best Baseline. The "Optimal" metric shows L-ICL methods achieving comparable performance to Best Baseline with fewer training examples but maintaining narrower confidence intervals. This could imply that L-ICL methods are more efficient but less robust to variability in training data. The divergence in performance between "Success" and "Optimal" rates highlights a potential trade-off between achieving high success rates and maintaining optimal behavior in the Gridworld environment.