## System Diagram: Reinforcement Learning with Model Feedback
### Overview
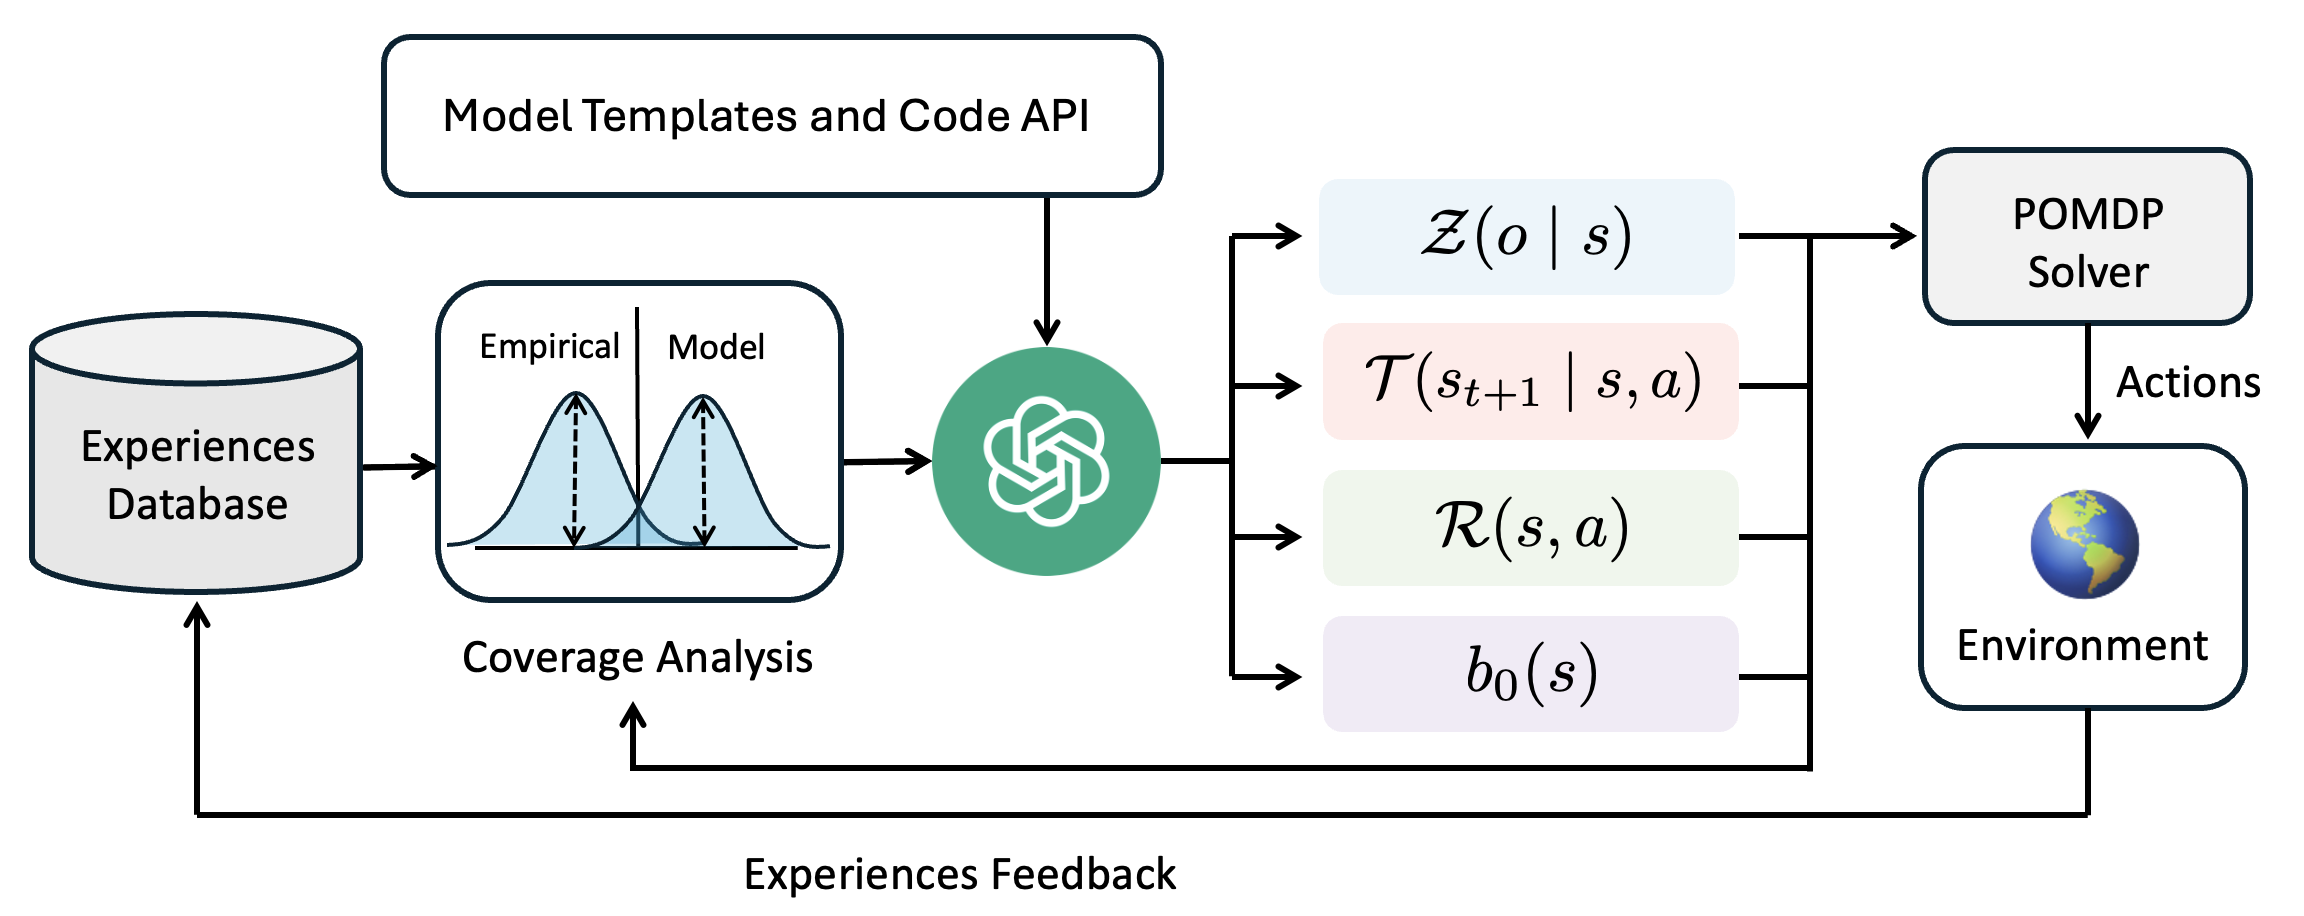
The image is a system diagram illustrating a reinforcement learning process, incorporating model templates, code APIs, and feedback loops. It shows the flow of information and interactions between different components, including an experiences database, coverage analysis, a model, a POMDP solver, and the environment.
### Components/Axes
* **Experiences Database:** A cylindrical shape labeled "Experiences Database" stores data.
* **Model Templates and Code API:** A rectangular box at the top labeled "Model Templates and Code API".
* **Coverage Analysis:** A box containing two bell curves labeled "Empirical" and "Model" above "Coverage Analysis".
* **Model:** A green circle containing a white logo, presumably representing the model.
* **Z(o | s):** A light blue rounded rectangle containing the expression "Z(o | s)".
* **T(s<sub>t+1</sub> | s, a):** A light pink rounded rectangle containing the expression "T(s<sub>t+1</sub> | s, a)".
* **R(s, a):** A light green rounded rectangle containing the expression "R(s, a)".
* **b<sub>0</sub>(s):** A light purple rounded rectangle containing the expression "b<sub>0</sub>(s)".
* **POMDP Solver:** A rectangular box labeled "POMDP Solver".
* **Actions:** A label indicating the output of the POMDP Solver.
* **Environment:** A rounded rectangle containing a globe image and labeled "Environment".
* **Experiences Feedback:** A label indicating the feedback loop from the environment to the experiences database.
### Detailed Analysis or ### Content Details
1. **Data Flow:**
* Data flows from the "Experiences Database" to the "Coverage Analysis" module.
* The "Coverage Analysis" module compares "Empirical" data with the "Model".
* The output of the "Coverage Analysis" module feeds into the green circle model.
* The "Model Templates and Code API" also feeds into the green circle model.
* The model outputs to "Z(o | s)", "T(s<sub>t+1</sub> | s, a)", "R(s, a)", and "b<sub>0</sub>(s)".
* These outputs feed into the "POMDP Solver".
* The "POMDP Solver" outputs "Actions" to the "Environment".
* The "Environment" provides "Experiences Feedback" back to the "Experiences Database", closing the loop.
2. **Mathematical Expressions:**
* Z(o | s): Represents the probability of observation 'o' given state 's'.
* T(s<sub>t+1</sub> | s, a): Represents the transition probability from state 's' to state 's<sub>t+1</sub>' given action 'a'.
* R(s, a): Represents the reward function for taking action 'a' in state 's'.
* b<sub>0</sub>(s): Represents the initial belief state over states 's'.
### Key Observations
* The diagram illustrates a closed-loop reinforcement learning system.
* The "Coverage Analysis" module compares empirical data with the model's predictions.
* The model receives input from both the "Coverage Analysis" and "Model Templates and Code API".
* The POMDP solver uses the model's outputs to determine actions in the environment.
* The environment provides feedback to the experiences database, allowing the system to learn and improve over time.
### Interpretation
The diagram represents a reinforcement learning system that incorporates model-based learning and feedback mechanisms. The "Coverage Analysis" module likely serves to identify discrepancies between the model's predictions and real-world experiences, allowing the model to be refined and improved. The inclusion of "Model Templates and Code API" suggests that the model can be customized and extended using external code and templates. The use of a POMDP solver indicates that the environment is partially observable, requiring the agent to maintain a belief state over possible states. The feedback loop from the environment to the experiences database enables the system to learn from its interactions with the environment and adapt its behavior accordingly.