## Flowchart: Meteorological Reasoning Process and Question Analysis
### Overview
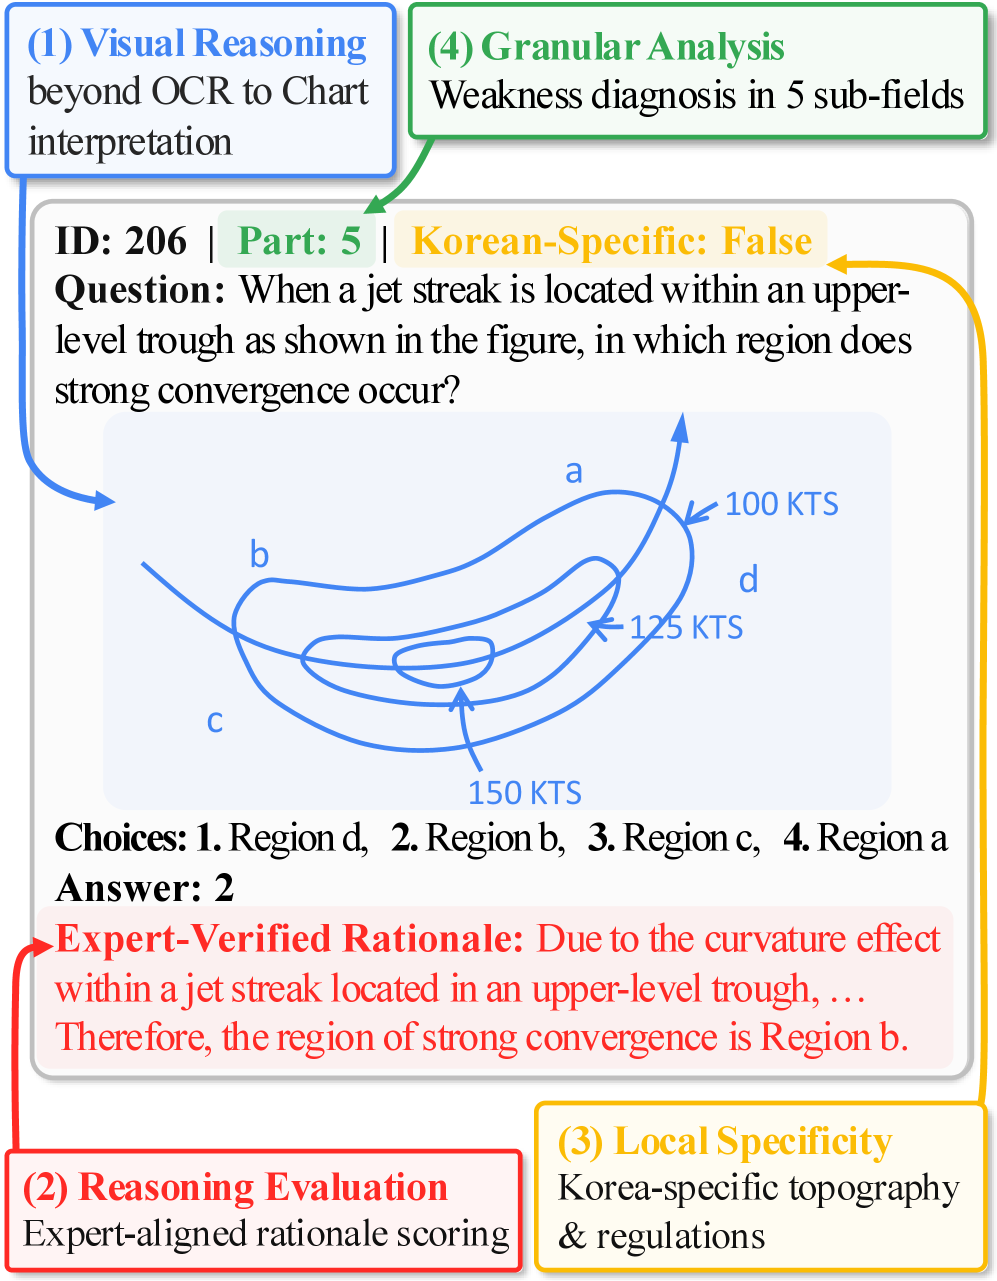
The image depicts a structured flowchart outlining a four-step reasoning process for analyzing meteorological phenomena, specifically jet streams and upper-level troughs. It includes a question with a diagram, multiple-choice answers, and an expert-verified rationale. The flowchart emphasizes visual reasoning, local specificity, and granular analysis, culminating in a weakness diagnosis across five sub-fields.
---
### Components/Axes
1. **Flowchart Sections**:
- **(1) Visual Reasoning**: "beyond OCR to Chart interpretation" (blue box).
- **(2) Reasoning Evaluation**: "Expert-aligned rationale scoring" (red box).
- **(3) Local Specificity**: "Korea-specific topography & regulations" (yellow box).
- **(4) Granular Analysis**: "Weakness diagnosis in 5 sub-fields" (green box).
2. **Question Section**:
- **ID**: 206 | **Part**: 5.
- **Question Text**: "When a jet streak is located within an upper-level trough as shown in the figure, in which region does strong convergence occur?"
- **Diagram**:
- **Regions**: Labeled **a**, **b**, **c**, **d**.
- **KTS Values**:
- **100 KTS** (top-right arrow).
- **125 KTS** (middle-right arrow).
- **150 KTS** (bottom-center arrow).
- **Arrows**: Blue lines with directional indicators (e.g., "b" loops around regions).
- **Choices**:
1. Region d
2. Region b
3. Region c
4. Region a
- **Answer**: 2 (Region b).
- **Expert-Verified Rationale**: "Due to the curvature effect within a jet streak located in an upper-level trough, ... Therefore, the region of strong convergence is Region b."
---
### Detailed Analysis
- **Flowchart Workflow**:
1. **Visual Reasoning** initiates the process, focusing on interpreting charts beyond OCR.
2. **Reasoning Evaluation** applies expert-aligned scoring to assess rationale quality.
3. **Local Specificity** introduces regional constraints (e.g., Korea-specific topography).
4. **Granular Analysis** diagnoses weaknesses across five sub-fields.
- **Question Diagram**:
- The diagram shows a stylized jet stream with labeled regions (**a-d**) and KTS values (100, 125, 150). Arrows indicate wind direction and curvature effects.
- **Key Text**: "Korean-Specific: False" (indicating the question is not region-specific to Korea).
---
### Key Observations
1. **Regional Convergence**: The answer (Region b) is tied to the curvature effect in a jet streak within an upper-level trough.
2. **KTS Values**: The diagram includes wind speeds (100–150 KTS), but their spatial relationship to regions is not explicitly mapped in the text.
3. **Process Integration**: The flowchart connects abstract reasoning steps (e.g., "Visual Reasoning") to concrete meteorological analysis (e.g., jet streak dynamics).
---
### Interpretation
- **Meteorological Insight**: The curvature effect in a jet streak within a trough causes air to converge in Region b, aligning with the answer. This reflects real-world dynamics where curved jet streams enhance convergence.
- **Educational Purpose**: The flowchart and question likely assess both technical knowledge (e.g., jet stream behavior) and analytical skills (e.g., linking diagrams to reasoning steps).
- **Weakness Diagnosis**: The final step (Granular Analysis) suggests the process identifies gaps in sub-fields like local specificity or visual interpretation, critical for refining models or training.
---
### Uncertainties
- **Diagram Placement**: The exact spatial arrangement of KTS values (100, 125, 150) relative to regions **a-d** is unclear without the visual diagram.
- **Sub-Field Details**: The five sub-fields for weakness diagnosis are not explicitly listed in the text.