## Line Chart: Cost Comparison of Knowledge Retrieval Methods
### Overview
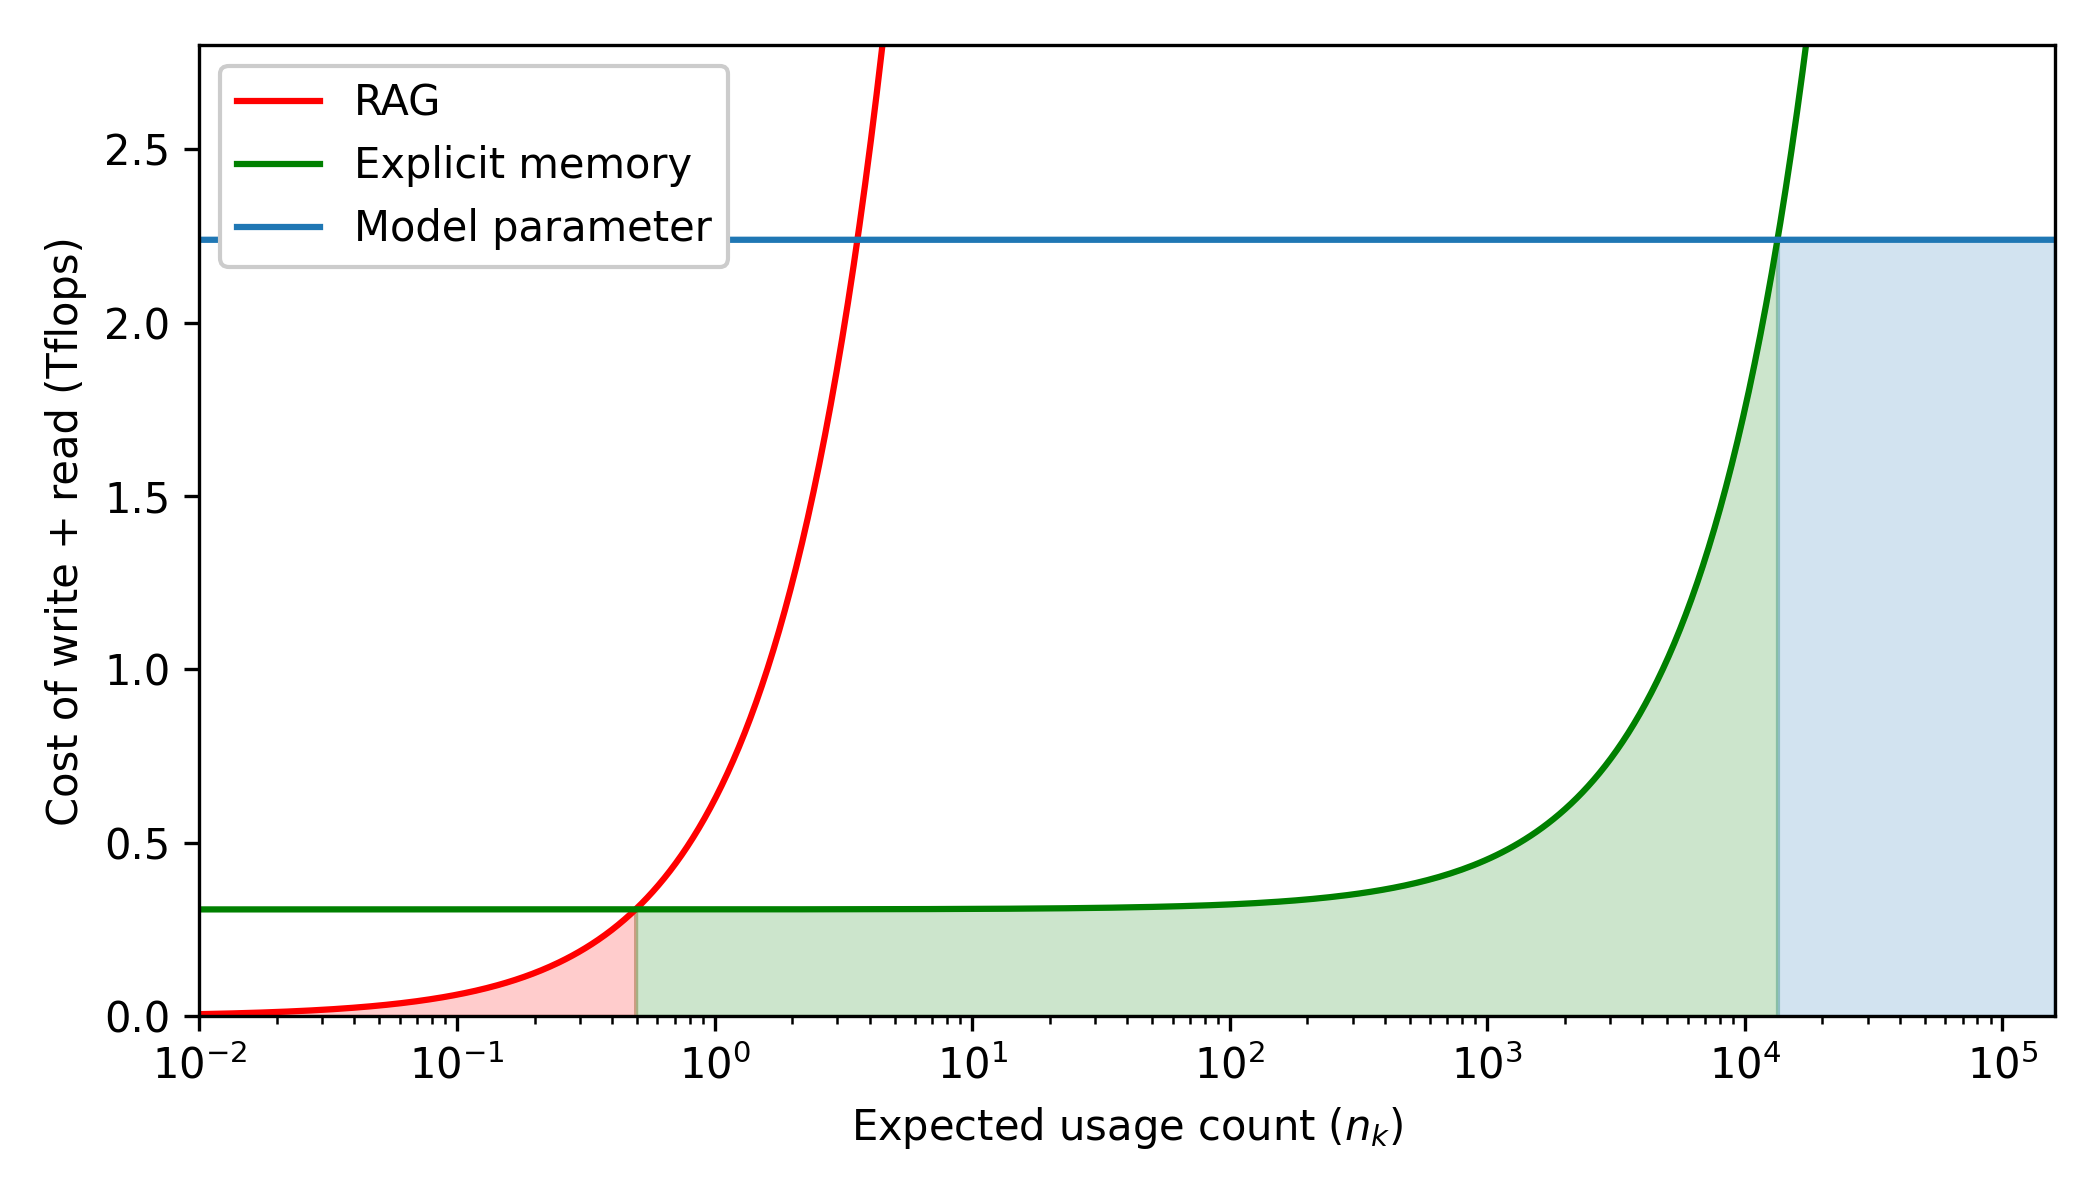
This image is a line chart comparing the computational cost (measured in Tflops) of three different methods for storing and retrieving information in AI models: RAG (Retrieval-Augmented Generation), Explicit memory, and Model parameter. The cost is plotted against the expected usage count of a specific piece of knowledge. The chart uses shaded regions to highlight the most cost-effective method across different usage frequencies.
### Components/Axes
**Legend (Positioned in the top-left corner):**
* **Red Line:** RAG
* **Green Line:** Explicit memory
* **Blue Line:** Model parameter
**X-Axis (Bottom):**
* **Label:** Expected usage count ($n_k$)
* **Scale:** Logarithmic (Base 10).
* **Major Markers:** $10^{-2}$, $10^{-1}$, $10^0$, $10^1$, $10^2$, $10^3$, $10^4$, $10^5$.
* **Minor Markers:** Tick marks are visible between the major logarithmic intervals, indicating standard logarithmic subdivisions.
**Y-Axis (Left):**
* **Label:** Cost of write + read (Tflops)
* **Scale:** Linear.
* **Markers:** 0.0, 0.5, 1.0, 1.5, 2.0, 2.5. (The axis extends slightly above 2.5, terminating around 2.8).
### Detailed Analysis
**Trend Verification and Data Extraction:**
1. **Model parameter (Blue Line):**
* *Trend:* The line is perfectly horizontal across the entire chart. This indicates that the combined cost of writing and reading remains constant regardless of how many times the knowledge is used.
* *Data Points:* The line is fixed at approximately **2.25 Tflops** from $X = 10^{-2}$ to $X = 10^5$.
2. **Explicit memory (Green Line):**
* *Trend:* The line begins flat and low, maintaining a constant cost for lower usage counts. As the usage count increases past $10^2$, the line curves upward, indicating an increasing marginal cost per read.
* *Data Points:*
* From $X = 10^{-2}$ to $X \approx 10^1$: Flat at approximately **0.3 Tflops**.
* At $X = 10^2$: Begins to rise slightly, $\approx$ **0.35 Tflops**.
* At $X = 10^3$: $\approx$ **0.45 Tflops**.
* At $X = 10^4$: $\approx$ **1.5 Tflops**.
* Intersection: Crosses the Blue line (2.25 Tflops) at $X \approx$ **$1.3 \times 10^4$**.
* Exits the top of the graph ($Y \approx 2.8$) at $X \approx$ **$1.8 \times 10^4$**.
3. **RAG (Red Line):**
* *Trend:* The line starts near zero and curves upward extremely rapidly. On this log-linear scale, it demonstrates the highest marginal cost per usage among the three methods.
* *Data Points:*
* At $X = 10^{-2}$: $\approx$ **0.0 Tflops**.
* At $X = 10^{-1}$: $\approx$ **0.05 Tflops**.
* Intersection: Crosses the Green line ($\approx$ 0.3 Tflops) at $X \approx$ **$5 \times 10^{-1}$** (or 0.5).
* At $X = 10^0$ (1): $\approx$ **0.6 Tflops**.
* Intersection: Crosses the Blue line (2.25 Tflops) at $X \approx$ **$3.5 \times 10^0$**.
* Exits the top of the graph ($Y \approx 2.8$) at $X \approx$ **$4.5 \times 10^0$**.
**Shaded Regions (Cost-Efficiency Zones):**
The chart features vertical shading under the lowest curve at any given point on the X-axis, indicating the most efficient method for that usage tier.
* **Red Shaded Area:** From $X = 10^{-2}$ to $X \approx 0.5$. Bounded by the Red line (RAG).
* **Green Shaded Area:** From $X \approx 0.5$ to $X \approx 1.3 \times 10^4$. Bounded by the Green line (Explicit memory).
* **Blue Shaded Area:** From $X \approx 1.3 \times 10^4$ to $X = 10^5$. Bounded by the Blue line (Model parameter).
### Key Observations
* **Crossover Point 1 (RAG to Explicit Memory):** At an expected usage count of approximately 0.5 ($5 \times 10^{-1}$), the cost of RAG exceeds the cost of Explicit memory.
* **Crossover Point 2 (Explicit Memory to Model Parameter):** At an expected usage count of approximately 13,000 ($1.3 \times 10^4$), the cost of Explicit memory exceeds the flat cost of Model parameters.
* **RAG Inefficiency at Scale:** RAG becomes computationally more expensive than baking knowledge into model parameters after only $\approx 3.5$ uses.
### Interpretation
This chart illustrates a fundamental architectural tradeoff in Large Language Models (LLMs) regarding how knowledge is stored and accessed. The Y-axis metric, "Cost of write + read," is the key to understanding the dynamics:
1. **Model Parameters (Blue):** Baking knowledge directly into the weights of a model (training/fine-tuning) represents a massive, one-time "write" cost ($\approx$ 2.25 Tflops). However, the "read" cost (inference) is effectively zero marginal overhead compared to standard generation. Therefore, the line is flat. This is highly inefficient for rare knowledge but becomes the most economical choice if a fact is expected to be recalled tens of thousands of times ($> 1.3 \times 10^4$).
2. **RAG (Red):** Retrieval-Augmented Generation has a near-zero "write" cost (simply adding text to a vector database). However, every single "read" requires a costly retrieval step and processing additional tokens in the context window. Therefore, the cost scales linearly with usage (which appears as a steep exponential curve on this logarithmic X-axis). RAG is only optimal for highly transient or rarely accessed knowledge (used less than 1 time on average).
3. **Explicit Memory (Green):** This represents a hybrid or intermediate architecture. It has a moderate upfront "write" cost ($\approx$ 0.3 Tflops) but scales much better than RAG. It serves as the optimal "middle ground" for the vast majority of knowledge that is accessed occasionally to moderately (between 1 and 13,000 times).
**Conclusion:** The data suggests a tiered memory architecture is optimal for AI systems. Ephemeral/rare facts should use RAG; moderately used facts should utilize an explicit memory module; and foundational, highly-accessed facts should be trained directly into the model parameters.