\n
## Chart: Cost of Write + Read vs. Expected Usage Count
### Overview
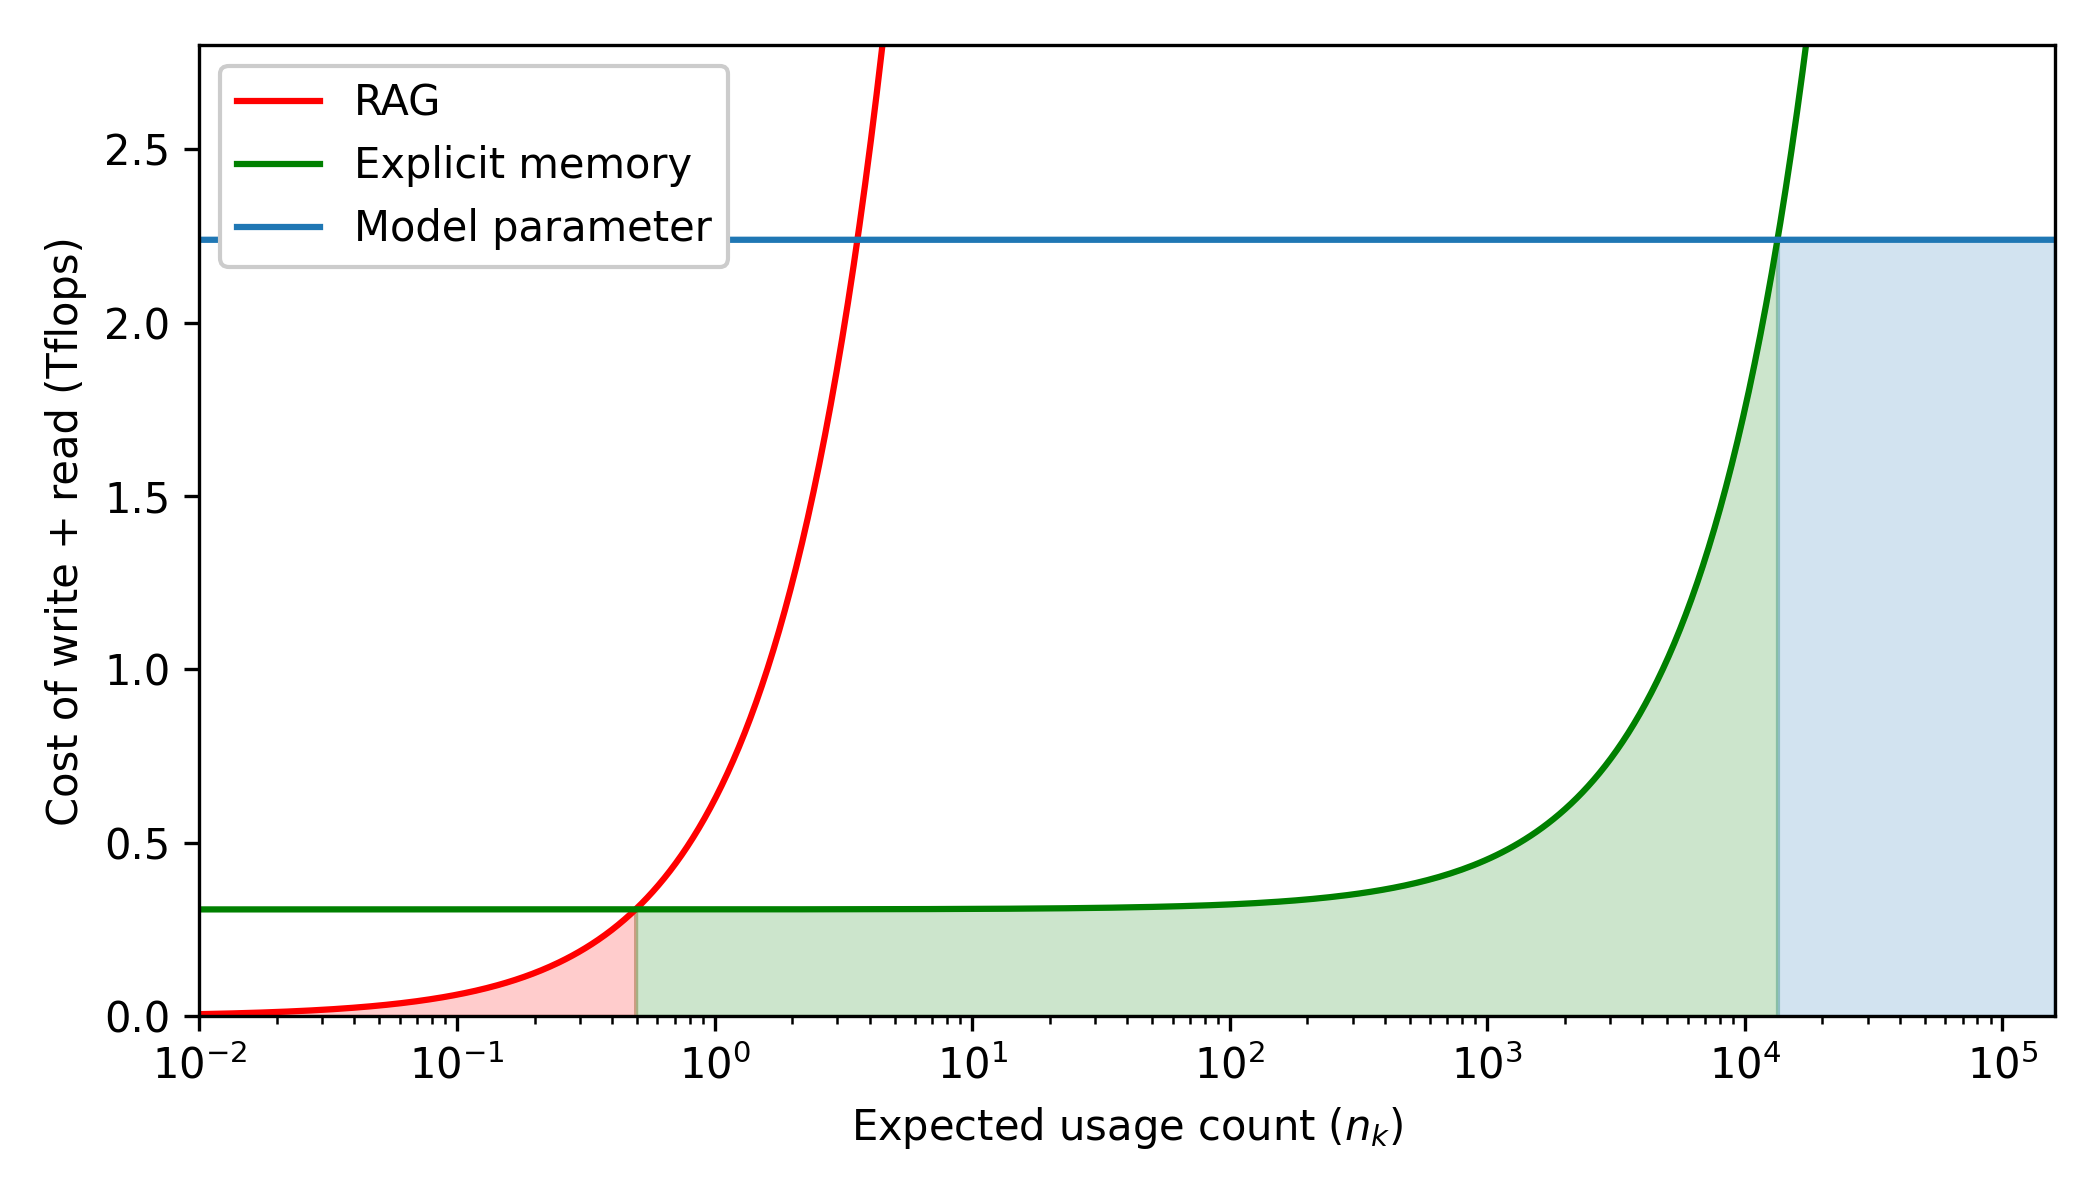
The image presents a chart comparing the computational cost (in TFlops) of write and read operations for three different approaches: RAG (Retrieval-Augmented Generation), Explicit Memory, and Model Parameters, as a function of expected usage count (nκ). The x-axis represents the expected usage count on a logarithmic scale, while the y-axis represents the cost of write + read in TFlops. The chart visually demonstrates the trade-offs between these approaches based on the frequency of usage.
### Components/Axes
* **X-axis:** "Expected usage count (nκ)" - Logarithmic scale from 10^-2 to 10^5.
* **Y-axis:** "Cost of write + read (TFlops)" - Linear scale from 0.0 to 2.5.
* **Legend:** Located in the top-left corner.
* Red Line: "RAG"
* Green Line: "Explicit memory"
* Blue Line: "Model parameter"
* **Shaded Regions:**
* Red shaded region: Under the RAG curve, extending from the y-axis to approximately nκ = 10^1.
* Green shaded region: Under the Explicit memory curve, extending from the y-axis to approximately nκ = 10^3.
* Blue shaded region: Under the Model parameter curve, extending from approximately nκ = 10^4 to the end of the x-axis.
### Detailed Analysis
* **RAG (Red Line):** The RAG line starts at approximately 0.2 TFlops at nκ = 10^-2 and rapidly increases, exhibiting a steep upward slope. At nκ = 1, the cost is approximately 0.8 TFlops. At nκ = 10, the cost is approximately 1.8 TFlops. The line plateaus around 2.4 TFlops for nκ > 10^1.
* **Explicit Memory (Green Line):** The Explicit Memory line begins at approximately 0.05 TFlops at nκ = 10^-2 and increases at a slower rate than the RAG line. The line exhibits a logarithmic growth pattern. At nκ = 10^3, the cost is approximately 0.4 TFlops. The line continues to increase, but at a diminishing rate, reaching approximately 0.6 TFlops at nκ = 10^5.
* **Model Parameter (Blue Line):** The Model Parameter line is nearly flat, remaining relatively constant across the entire range of expected usage counts. It starts at approximately 2.1 TFlops at nκ = 10^-2 and remains around 2.2 TFlops until nκ = 10^4, after which it remains constant.
### Key Observations
* For low usage counts (nκ < 10^1), RAG is relatively inexpensive, but its cost increases rapidly.
* Explicit Memory is the most cost-effective approach for moderate usage counts (10^1 < nκ < 10^3).
* Model Parameters have a consistently high cost, regardless of usage count.
* There is a crossover point around nκ = 10^1 where RAG becomes more expensive than Explicit Memory.
* There is a crossover point around nκ = 10^4 where Explicit Memory becomes more expensive than Model Parameters.
### Interpretation
The chart illustrates the cost trade-offs between different methods for incorporating external knowledge into a model. RAG is efficient for infrequent use but becomes prohibitively expensive as usage increases due to the repeated retrieval and processing of information. Explicit Memory offers a more scalable solution for moderate usage, as its cost grows logarithmically. However, for very frequent usage, storing knowledge directly within the model parameters becomes the most cost-effective approach, despite the initial high cost.
The shaded regions visually emphasize the range of usage counts where each approach is most advantageous. The chart suggests that the optimal choice of method depends heavily on the expected frequency of knowledge access. The flat line for Model Parameters indicates that the cost of storing information within the model itself is independent of how often that information is used. This could be due to the cost being dominated by the initial training or parameter update process. The steep rise of the RAG line suggests that the cost of retrieval and processing becomes the bottleneck as usage increases.