## Line Graph: Cost of Write + Read vs. Expected Usage Count
### Overview
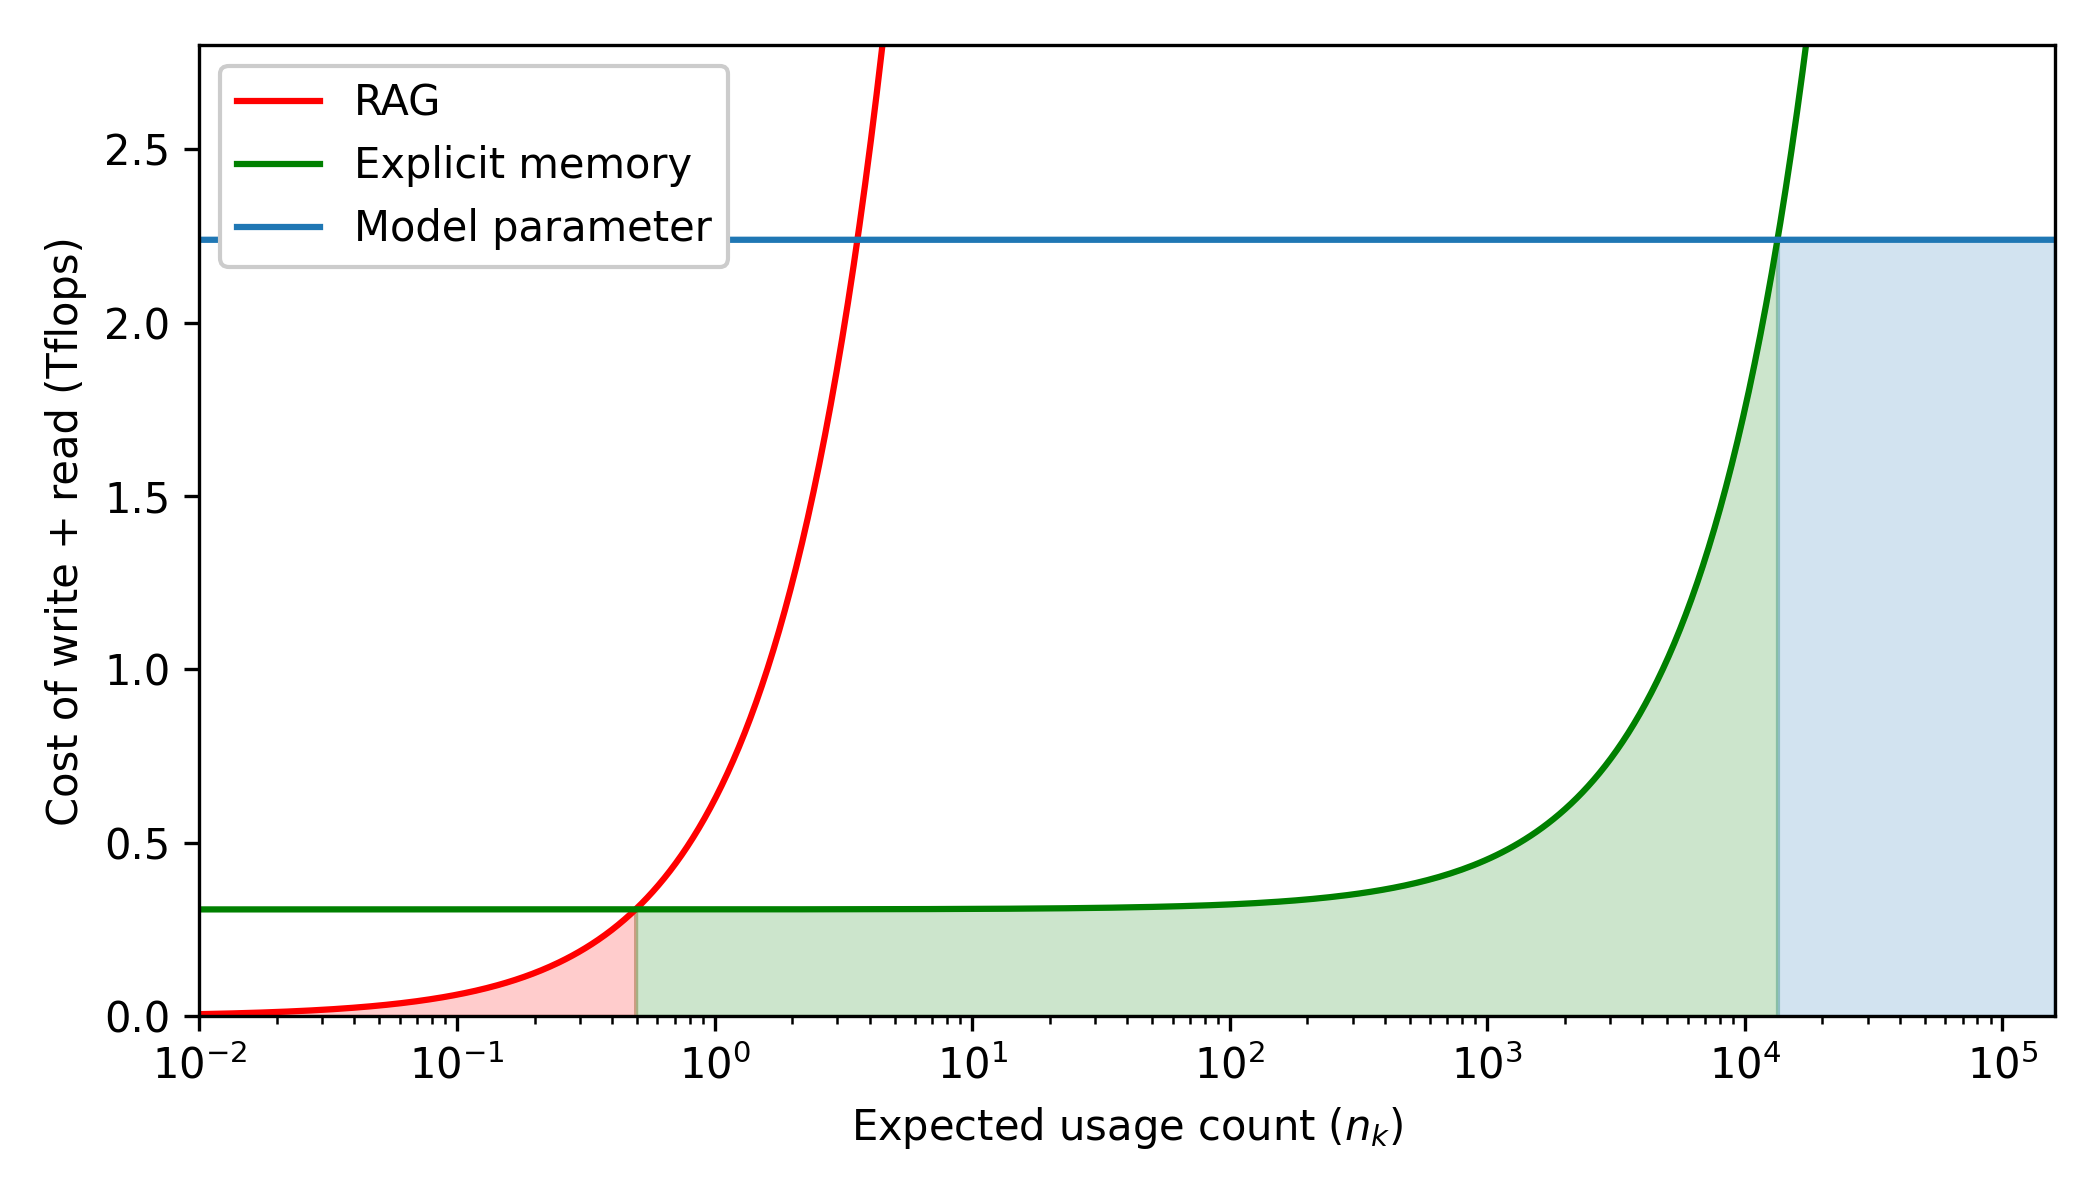
The graph compares three cost models (RAG, Explicit memory, Model parameter) against expected usage count (n_k) on a logarithmic scale. The y-axis represents computational cost in teraflops (Tflops), while the x-axis spans from 10⁻² to 10⁵ usage counts. Shaded regions highlight cost-efficient ranges for each method relative to the Model parameter baseline.
### Components/Axes
- **X-axis**: Expected usage count (n_k) [log scale: 10⁻², 10⁻¹, 10⁰, 10¹, 10², 10³, 10⁴, 10⁵]
- **Y-axis**: Cost of write + read (Tflops) [linear scale: 0.0 to 2.5]
- **Legend**:
- Red: RAG
- Green: Explicit memory
- Blue: Model parameter
- **Shaded regions**:
- Red: Below RAG line (n_k < 10⁰)
- Green: Below Explicit memory line (10⁰ ≤ n_k ≤ 10⁴)
### Detailed Analysis
1. **RAG (Red line)**:
- Starts at 0 Tflops (n_k = 10⁻²)
- Exponential growth: Crosses Explicit memory line at n_k ≈ 10⁰
- Reaches ~2.5 Tflops at n_k = 10⁵
- Steepest slope in log-linear space (doubles cost every 10x usage increase)
2. **Explicit memory (Green line)**:
- Flat at ~0.3 Tflops until n_k = 10⁰
- Gradual increase after n_k = 10⁰
- Crosses Model parameter line at n_k ≈ 10⁴
- Reaches ~2.5 Tflops at n_k = 10⁵
3. **Model parameter (Blue line)**:
- Horizontal at ~2.2 Tflops across all n_k
- Acts as cost ceiling for comparison
### Key Observations
- **Threshold behavior**:
- RAG dominates (cheapest) for n_k < 10⁰
- Explicit memory becomes optimal between 10⁰ and 10⁴
- Model parameter becomes most efficient beyond 10⁴
- **Exponential scaling**: RAG's cost grows 100x faster than Explicit memory in log space
- **Saturation point**: All methods converge near 2.5 Tflops at maximum n_k
### Interpretation
The graph demonstrates a trade-off between computational efficiency and scalability:
1. **RAG** is optimal for low-frequency access patterns (n_k < 10⁰) but becomes prohibitively expensive at scale
2. **Explicit memory** offers mid-range efficiency (10⁰–10⁴) with predictable scaling
3. **Model parameter** represents a fixed-cost baseline, becoming most cost-effective for high-frequency access (n_k > 10⁴)
The shaded regions visually confirm these thresholds, suggesting system architects should:
- Use RAG for infrequent queries
- Transition to Explicit memory for moderate usage
- Adopt Model parameter for high-throughput scenarios
The log-scale x-axis emphasizes the dramatic cost differences at scale, particularly highlighting RAG's unsustainable growth beyond n_k = 10¹.