## Diagram: Multi-Head Attention Layer Analysis
### Overview
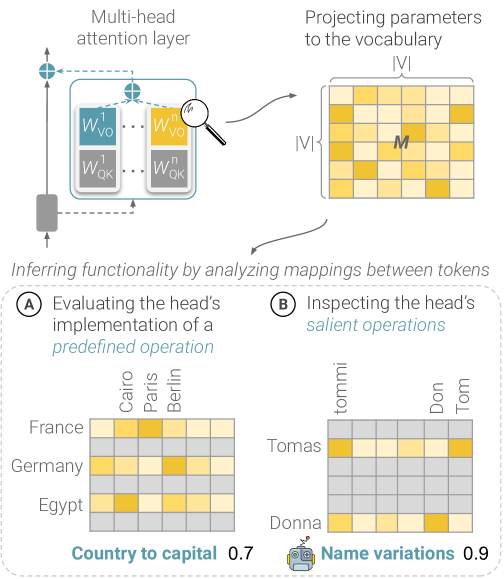
The image illustrates the analysis of a multi-head attention layer in a neural network. It shows how the layer projects parameters to a vocabulary and infers functionality by analyzing mappings between tokens. Two specific analyses are presented: evaluating the head's implementation of a predefined operation (country to capital) and inspecting the head's salient operations (name variations).
### Components/Axes
* **Top:**
* "Multi-head attention layer"
* Diagram of the attention layer with blocks labeled "W<sup>1</sup><sub>VO</sub>", "W<sup>n</sup><sub>VO</sub>", "W<sup>1</sup><sub>QK</sub>", "W<sup>n</sup><sub>QK</sub>".
* "Projecting parameters to the vocabulary |V|"
* A grid representing the vocabulary projection, with dimensions |V| x |V|, and a cell labeled "M".
* **Middle:**
* "Inferring functionality by analyzing mappings between tokens"
* **Bottom:**
* **(A) Evaluating the head's implementation of a predefined operation**
* Heatmap showing the relationship between countries (France, Germany, Egypt) and capitals (Cairo, Paris, Berlin).
* "Country to capital 0.7"
* **(B) Inspecting the head's salient operations**
* Heatmap showing the relationship between names (Tomas, Donna) and name variations (tommi, Don, Tom).
* "Name variations 0.9"
### Detailed Analysis
**Multi-head attention layer:**
* The diagram shows a multi-head attention layer. The layer contains multiple attention heads, each with its own set of weights (W<sup>1</sup><sub>VO</sub>, W<sup>n</sup><sub>VO</sub>, W<sup>1</sup><sub>QK</sub>, W<sup>n</sup><sub>QK</sub>).
**Projecting parameters to the vocabulary:**
* The parameters are projected to a vocabulary of size |V|. The projection results in a matrix M of size |V| x |V|.
**Evaluating the head's implementation of a predefined operation (Country to capital):**
* **Rows (Countries):** France, Germany, Egypt
* **Columns (Capitals):** Cairo, Paris, Berlin
* **Heatmap Data:**
* France - Cairo: Low
* France - Paris: Medium-High
* France - Berlin: Low
* Germany - Cairo: Low
* Germany - Paris: Low
* Germany - Berlin: Medium-High
* Egypt - Cairo: Medium-High
* Egypt - Paris: Low
* Egypt - Berlin: Low
* **Score:** 0.7
**Inspecting the head's salient operations (Name variations):**
* **Rows (Names):** Tomas, Donna
* **Columns (Name Variations):** tommi, Don, Tom
* **Heatmap Data:**
* Tomas - tommi: Medium-High
* Tomas - Don: Low
* Tomas - Tom: Low
* Donna - tommi: Medium-High
* Donna - Don: Low
* Donna - Tom: Low
* **Score:** 0.9
### Key Observations
* The "Country to capital" heatmap shows that the model correctly associates France with Paris, Germany with Berlin, and Egypt with Cairo, although the intensity varies.
* The "Name variations" heatmap shows that the model associates both Tomas and Donna with the variation "tommi".
### Interpretation
The diagram illustrates how multi-head attention layers can be analyzed to understand their functionality. By examining the mappings between tokens, we can infer what operations the attention heads are performing. The "Country to capital" example shows that the model has learned some basic geographical knowledge. The "Name variations" example shows that the model has learned to associate names with their variations. The scores (0.7 and 0.9) indicate the confidence or strength of these associations. The higher score for "Name variations" suggests that the model is more confident in its ability to identify name variations than in its knowledge of country-capital relationships.