\n
## Diagram: Multi-head Attention Layer and Token Mapping Analysis
### Overview
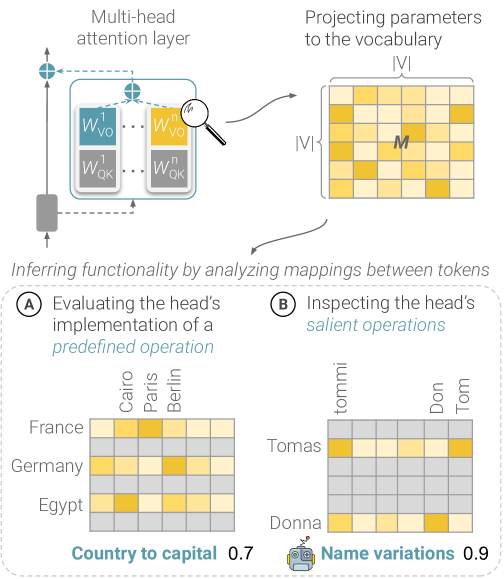
The image is a diagram illustrating the process of inferring functionality within a multi-head attention layer by analyzing mappings between tokens. It depicts a multi-head attention layer, parameter projection to a vocabulary, and two methods for evaluating the layer's operation: mapping countries to capitals and name variations. The diagram uses a grid-based visualization to represent these mappings, with color intensity indicating the strength of the association.
### Components/Axes
The diagram consists of the following components:
* **Multi-head attention layer:** Represented as a rectangular block with input and output arrows. Inside the block are labeled matrices: W<sub>VQ</sub><sup>1</sup>, W<sub>QK</sub><sup>1</sup>, W<sub>VQ</sub><sup>n</sup>, W<sub>QK</sub><sup>n</sup>. A magnifying glass highlights a portion of the layer.
* **Projecting parameters to the vocabulary:** A grid of cells representing the vocabulary, with a highlighted cell labeled "M". The grid is labeled "|V|" on both axes.
* **Inferring functionality by analyzing mappings between tokens:** A descriptive label for the lower portion of the diagram.
* **A: Evaluating the head's implementation of a predefined operation:** A label for the "Country to capital" mapping grid.
* **B: Inspecting the head's salient operations:** A label for the "Name variations" mapping grid.
* **Country to capital grid:** A 3x3 grid with rows labeled "France", "Germany", and "Egypt", and columns labeled "Cairo", "Paris", and "Berlin".
* **Name variations grid:** A 2x3 grid with rows labeled "Tomas" and "Donna", and columns labeled "tommi", "Don", and "Tom".
* **Association Strength Indicators:** Color intensity within the grids represents the strength of the association between tokens.
* **Association Scores:** "0.7" is displayed below the "Country to capital" grid, and "0.9" is displayed below the "Name variations" grid.
### Detailed Analysis or Content Details
**Multi-head Attention Layer:**
* The layer contains matrices labeled W<sub>VQ</sub><sup>1</sup>, W<sub>QK</sub><sup>1</sup>, W<sub>VQ</sub><sup>n</sup>, and W<sub>QK</sub><sup>n</sup>. These likely represent weight matrices for query, key, and value transformations within the attention mechanism. The superscript 'n' suggests multiple heads.
* The magnifying glass focuses on a portion of the layer, implying detailed inspection of specific weights.
**Projecting Parameters to the Vocabulary:**
* The grid represents the vocabulary space, with dimensions labeled "|V|". The size of the grid is approximately 8x8.
* The cell labeled "M" is highlighted, potentially indicating a specific token or parameter of interest.
**Country to Capital Mapping (A):**
* The grid shows associations between countries and their capitals.
* France - Paris: Strong association (dark yellow).
* France - Cairo: Weak association (light yellow).
* France - Berlin: Weak association (light yellow).
* Germany - Cairo: Weak association (light yellow).
* Germany - Paris: Weak association (light yellow).
* Germany - Berlin: Strong association (dark yellow).
* Egypt - Cairo: Strong association (dark yellow).
* Egypt - Paris: Weak association (light yellow).
* Egypt - Berlin: Weak association (light yellow).
* The overall association score is 0.7.
**Name Variations Mapping (B):**
* The grid shows associations between name variations.
* Tomas - tommi: Strong association (dark yellow).
* Tomas - Don: Weak association (light yellow).
* Tomas - Tom: Weak association (light yellow).
* Donna - tommi: Weak association (light yellow).
* Donna - Don: Strong association (dark yellow).
* Donna - Tom: Weak association (light yellow).
* The overall association score is 0.9.
### Key Observations
* The "Name variations" mapping (0.9) has a higher association score than the "Country to capital" mapping (0.7), suggesting the attention head is better at capturing relationships between name variations.
* The grids use a color gradient to represent the strength of the association, with darker yellow indicating a stronger relationship.
* The multi-head attention layer is depicted as a complex component with multiple weight matrices.
### Interpretation
The diagram illustrates a method for understanding the internal workings of a multi-head attention layer. By analyzing how the layer maps tokens (countries to capitals, name variations), researchers can infer the functionality and salient operations of the layer. The higher association score for name variations suggests that the attention head may be particularly sensitive to subtle differences in names. The use of grid-based visualizations allows for a clear and intuitive representation of these mappings. The diagram highlights the importance of examining the internal representations learned by attention mechanisms to gain insights into their behavior. The "M" in the vocabulary projection could represent a key parameter or token that the attention head focuses on. The overall goal is to move beyond treating attention layers as "black boxes" and to develop a deeper understanding of their internal logic.