## Diagram: Multi-head Attention Layer and Token Mapping Analysis
### Overview
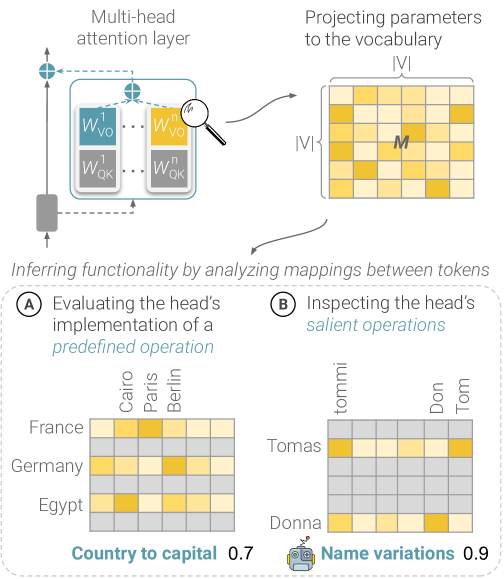
The diagram illustrates a multi-head attention layer in a neural network, focusing on how parameters are projected to vocabulary and how token mappings reveal functional insights. It includes two heatmaps analyzing token relationships: (A) country-to-capital associations and (B) name variation mappings.
### Components/Axes
1. **Main Diagram Elements**:
- **Multi-head attention layer**: Contains matrices labeled `W_VO`, `W_QK` (with superscripts `1` and `n`).
- **Projecting parameters to vocabulary**: A heatmap grid labeled with "IV" (Roman numeral) and "M" (matrix).
- **Inferring functionality**: Arrows connect the attention layer to heatmaps, emphasizing token mapping analysis.
2. **Heatmap A (Country to Capital)**:
- **X-axis**: Cities (Cairo, Paris, Berlin).
- **Y-axis**: Countries (France, Germany, Egypt).
- **Values**: Intensity gradients (light yellow to dark yellow) with approximate value `0.7` noted.
3. **Heatmap B (Name Variations)**:
- **X-axis**: Name variations (Tomas, Don, Tom).
- **Y-axis**: Names (Tommi, Donna).
- **Values**: Intensity gradients with approximate value `0.9` noted.
- **Legend**: Robot icon labeled "Name variations 0.9" in bottom-right corner.
4. **Textual Labels**:
- Section A: "Evaluating the head’s implementation of a predefined operation".
- Section B: "Inspecting the head’s salient operations".
### Detailed Analysis
- **Heatmap A**:
- France-Cairo: Darkest cell (highest intensity).
- Germany-Berlin: Moderate intensity.
- Egypt: No strong associations (lighter cells).
- All values approximate `0.7`.
- **Heatmap B**:
- Tomas-Tommi: Darkest cell.
- Donna-Tom: Moderate intensity.
- Other cells: Lighter shades.
- All values approximate `0.9`.
### Key Observations
1. **Country-Capital Mappings**:
- Strongest association: France-Cairo (darkest cell).
- Weakest: Egypt (no dark cells).
- Germany-Berlin shows moderate association.
2. **Name Variations**:
- Tomas-Tommi and Donna-Tom show strongest associations (darkest cells).
- Other combinations (e.g., Tomas-Don) have weaker links.
3. **Legend Placement**:
- Robot icon (name variations) is spatially isolated in bottom-right, distinct from heatmap grids.
### Interpretation
The diagram demonstrates how attention mechanisms in neural networks prioritize specific token relationships. The country-capital heatmap (A) reveals geographic/cultural biases in parameter projections, with France-Cairo being the strongest link. The name variation heatmap (B) highlights phonetic/semantic similarities, with Tomas-Tommi showing the highest salience. The `0.7` and `0.9` values suggest confidence scores for these mappings, with name variations having higher salience. The robot icon’s placement emphasizes its role as a metadata label rather than a data point. This analysis aligns with Peircean semiotics, where the attention layer acts as an interpretant, mapping signs (tokens) to their interpretive effects (heatmap intensities).