## Line Chart: I-Don't-Know Rate vs. Layer for Llama Models
### Overview
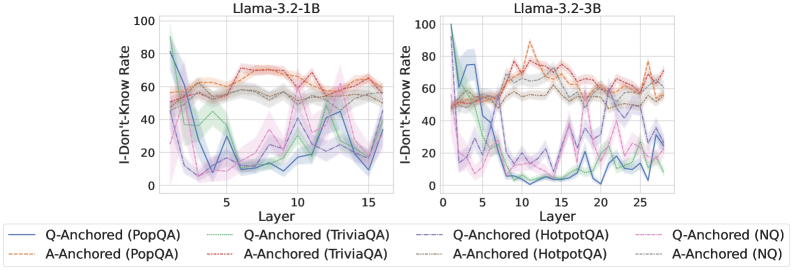
The image presents two line charts, side-by-side, depicting the "I-Don't-Know Rate" as a function of "Layer" for two different Llama models: Llama-3.2-1B and Llama-3.2-3B. Each chart displays multiple lines representing different question-answering datasets and anchoring methods. The charts aim to illustrate how the rate of the model responding with "I-Don't-Know" changes as the model's layers increase.
### Components/Axes
* **X-axis:** "Layer" - Ranges from approximately 0 to 15 for the Llama-3.2-1B chart and from 0 to 25 for the Llama-3.2-3B chart.
* **Y-axis:** "I-Don't-Know Rate" - Ranges from 0 to 100.
* **Legend:** Located at the bottom of the image, identifies the different lines. The legend includes:
* Q-Anchored (PopQA) - Blue line
* A-Anchored (PopQA) - Orange dotted line
* Q-Anchored (TriviaQA) - Green line
* A-Anchored (TriviaQA) - Red dotted line
* Q-Anchored (HotpotQA) - Gray dashed line
* A-Anchored (HotpotQA) - Brown dashed line
* Q-Anchored (NQ) - Light Blue line
* A-Anchored (NQ) - Pink line
### Detailed Analysis or Content Details
**Llama-3.2-1B Chart:**
* **Q-Anchored (PopQA):** Starts at approximately 75, decreases sharply to around 10 at layer 5, then fluctuates between 20 and 50 until layer 15.
* **A-Anchored (PopQA):** Starts at approximately 70, decreases to around 40 at layer 5, then remains relatively stable between 40 and 60 until layer 15.
* **Q-Anchored (TriviaQA):** Starts at approximately 60, decreases to around 15 at layer 5, then fluctuates between 20 and 40 until layer 15.
* **A-Anchored (TriviaQA):** Starts at approximately 65, decreases to around 45 at layer 5, then remains relatively stable between 40 and 60 until layer 15.
* **Q-Anchored (HotpotQA):** Starts at approximately 80, decreases to around 20 at layer 5, then fluctuates between 30 and 50 until layer 15.
* **A-Anchored (HotpotQA):** Starts at approximately 75, decreases to around 40 at layer 5, then remains relatively stable between 40 and 60 until layer 15.
* **Q-Anchored (NQ):** Starts at approximately 70, decreases to around 10 at layer 5, then fluctuates between 20 and 50 until layer 15.
* **A-Anchored (NQ):** Starts at approximately 65, decreases to around 30 at layer 5, then remains relatively stable between 40 and 60 until layer 15.
**Llama-3.2-3B Chart:**
* **Q-Anchored (PopQA):** Starts at approximately 80, decreases sharply to around 10 at layer 5, then fluctuates between 20 and 50 until layer 25.
* **A-Anchored (PopQA):** Starts at approximately 75, decreases to around 40 at layer 5, then remains relatively stable between 40 and 60 until layer 25.
* **Q-Anchored (TriviaQA):** Starts at approximately 70, decreases to around 15 at layer 5, then fluctuates between 20 and 40 until layer 25.
* **A-Anchored (TriviaQA):** Starts at approximately 65, decreases to around 45 at layer 5, then remains relatively stable between 40 and 60 until layer 25.
* **Q-Anchored (HotpotQA):** Starts at approximately 85, decreases to around 20 at layer 5, then fluctuates between 30 and 50 until layer 25.
* **A-Anchored (HotpotQA):** Starts at approximately 80, decreases to around 40 at layer 5, then remains relatively stable between 40 and 60 until layer 25.
* **Q-Anchored (NQ):** Starts at approximately 75, decreases to around 10 at layer 5, then fluctuates between 20 and 50 until layer 25.
* **A-Anchored (NQ):** Starts at approximately 70, decreases to around 30 at layer 5, then remains relatively stable between 40 and 60 until layer 25.
### Key Observations
* In both charts, all lines exhibit a significant decrease in "I-Don't-Know Rate" between layers 0 and 5.
* After layer 5, the lines generally stabilize, with fluctuations between approximately 20% and 60%.
* The "Q-Anchored" lines generally have lower "I-Don't-Know Rates" than the "A-Anchored" lines, suggesting that question anchoring is more effective than answer anchoring.
* The Llama-3.2-3B model appears to have a slightly higher initial "I-Don't-Know Rate" compared to the Llama-3.2-1B model, but the overall trends are similar.
* The HotpotQA dataset consistently shows a higher "I-Don't-Know Rate" compared to other datasets.
### Interpretation
The data suggests that increasing the number of layers in the Llama models initially leads to a significant reduction in the rate at which the model responds with "I-Don't-Know." This indicates that the model is learning to provide answers more confidently as it processes more information. However, beyond a certain number of layers (around 5 in this case), the improvement plateaus, and the "I-Don't-Know Rate" stabilizes.
The difference between "Q-Anchored" and "A-Anchored" lines suggests that the way the question is presented (or anchored) has a greater impact on the model's confidence than the way the answer is presented. This could be because the model relies more heavily on understanding the question to formulate a response.
The higher "I-Don't-Know Rate" for the HotpotQA dataset may indicate that this dataset contains more complex or ambiguous questions that are more challenging for the model to answer. The fact that the trends are similar for both models suggests that the underlying phenomenon is related to the model architecture and training process, rather than specific characteristics of either model. The larger model (3B) has a higher initial rate, but the same overall trend. This suggests that simply increasing model size does not necessarily solve the problem of uncertainty, but can improve performance up to a point.