TECHNICAL ASSET FINGERPRINT
0b0309b2490474fd11930754
Click to view fullscreen
Press ESC or click to close
FOUND IN PAPERS
EXPERT: healer-alpha-free VERSION 1
RUNTIME: free/openrouter/healer-alpha
INTEL_VERIFIED
## Line Charts: I-Don't-Know Rate Across Model Layers
### Overview
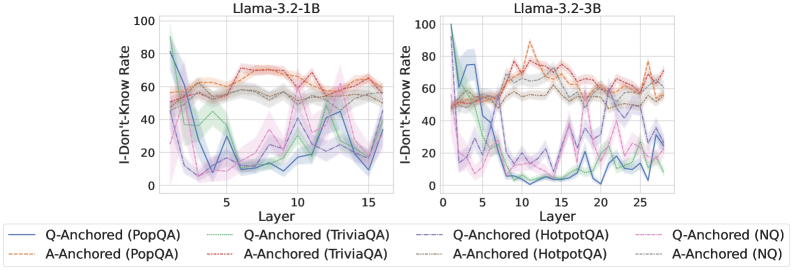
The image displays two side-by-side line charts comparing the "I-Don't-Know Rate" across the layers of two different language models: Llama-3.2-1B (left) and Llama-3.2-3B (right). Each chart plots multiple data series representing different question-answering datasets and two anchoring methods ("Q-Anchored" and "A-Anchored"). The charts include shaded regions around each line, likely representing confidence intervals or standard deviation.
### Components/Axes
* **Chart Titles:**
* Left Chart: `Llama-3.2-1B`
* Right Chart: `Llama-3.2-3B`
* **Y-Axis (Both Charts):**
* Label: `I-Don't-Know Rate`
* Scale: 0 to 100, with major tick marks at 0, 20, 40, 60, 80, 100.
* **X-Axis (Both Charts):**
* Label: `Layer`
* Left Chart Scale: 0 to 15, with major tick marks at 5, 10, 15.
* Right Chart Scale: 0 to 25, with major tick marks at 10, 20, 25.
* **Legend (Bottom, spanning both charts):**
* The legend is positioned below the x-axes of both charts.
* It defines 8 data series, differentiated by color and line style (solid vs. dashed).
* **Q-Anchored Series (Solid Lines):**
* Blue: `Q-Anchored (PopQA)`
* Green: `Q-Anchored (TriviaQA)`
* Purple: `Q-Anchored (HotpotQA)`
* Pink: `Q-Anchored (NQ)`
* **A-Anchored Series (Dashed Lines):**
* Orange: `A-Anchored (PopQA)`
* Red: `A-Anchored (TriviaQA)`
* Brown: `A-Anchored (HotpotQA)`
* Gray: `A-Anchored (NQ)`
### Detailed Analysis
**Llama-3.2-1B Chart (Left):**
* **General Trend:** Q-Anchored (solid) lines show a dramatic, steep decline from high initial rates (approx. 80-95) in early layers (1-3) to much lower rates (approx. 10-40) by layer 5, after which they fluctuate. A-Anchored (dashed) lines start lower (approx. 50-60) and remain relatively stable or show a slight, gradual increase across layers, generally staying between 50-70.
* **Specific Series Observations:**
* `Q-Anchored (PopQA)` (Blue, Solid): Starts highest (~95), plummets to ~10 by layer 5, then fluctuates between ~10-40.
* `Q-Anchored (TriviaQA)` (Green, Solid): Starts ~85, drops to ~20 by layer 5, fluctuates between ~10-40.
* `Q-Anchored (HotpotQA)` (Purple, Solid): Starts ~80, drops to ~20 by layer 5, shows more volatility, peaking near ~50 around layer 12.
* `Q-Anchored (NQ)` (Pink, Solid): Starts ~80, drops to ~30 by layer 5, fluctuates between ~20-50.
* `A-Anchored (PopQA)` (Orange, Dashed): Starts ~55, rises gradually to ~70 by layer 10, ends ~65.
* `A-Anchored (TriviaQA)` (Red, Dashed): Starts ~55, rises to ~70 by layer 7, remains around 65-70.
* `A-Anchored (HotpotQA)` (Brown, Dashed): Starts ~50, rises to ~60 by layer 5, stays near 60.
* `A-Anchored (NQ)` (Gray, Dashed): Starts ~50, rises to ~60 by layer 5, stays near 60.
**Llama-3.2-3B Chart (Right):**
* **General Trend:** Similar pattern to the 1B model but with more pronounced separation and volatility. Q-Anchored lines again show a sharp early decline. A-Anchored lines are more volatile than in the 1B model but still maintain a higher average rate than the Q-Anchored lines after the initial layers.
* **Specific Series Observations:**
* `Q-Anchored (PopQA)` (Blue, Solid): Starts ~100, crashes to near 0 by layer 10, remains very low (<10).
* `Q-Anchored (TriviaQA)` (Green, Solid): Starts ~90, drops to ~10 by layer 10, fluctuates between ~5-30.
* `Q-Anchored (HotpotQA)` (Purple, Solid): Starts ~80, drops to ~20 by layer 10, highly volatile, spikes to ~50 around layer 20.
* `Q-Anchored (NQ)` (Pink, Solid): Starts ~80, drops to ~20 by layer 10, fluctuates between ~10-40.
* `A-Anchored (PopQA)` (Orange, Dashed): Starts ~50, highly volatile, peaks near ~90 around layer 12, ends ~70.
* `A-Anchored (TriviaQA)` (Red, Dashed): Starts ~50, rises to ~80 by layer 10, fluctuates between 60-80.
* `A-Anchored (HotpotQA)` (Brown, Dashed): Starts ~50, rises to ~70 by layer 10, fluctuates between 60-70.
* `A-Anchored (NQ)` (Gray, Dashed): Starts ~50, rises to ~65 by layer 10, fluctuates between 55-65.
### Key Observations
1. **Anchoring Method Dominance:** The most striking pattern is the fundamental difference between Q-Anchored and A-Anchored methods. Q-Anchored rates collapse in early layers, while A-Anchored rates remain high and stable or increase.
2. **Model Size Effect:** The larger 3B model shows more extreme behavior: a deeper collapse for Q-Anchored (especially PopQA) and greater volatility for A-Anchored series.
3. **Dataset Variation:** Within each anchoring method, different datasets (PopQA, TriviaQA, HotpotQA, NQ) follow similar broad trends but have distinct absolute values and volatility profiles. PopQA often shows the most extreme values.
4. **Layer Sensitivity:** The critical transition for Q-Anchored methods occurs within the first 5-10 layers. After this point, rates stabilize at a lower level with noise.
### Interpretation
This data visualizes how a model's expressed uncertainty ("I-Don't-Know Rate") evolves through its processing layers, heavily influenced by the prompting strategy (anchoring to the Question vs. the Answer).
* **Q-Anchored (Question-Anchored):** The sharp early decline suggests that when prompted with the question, the model quickly moves from a state of high expressed uncertainty to one of lower uncertainty (or higher confidence) within its first few processing stages. This could indicate rapid pattern matching or retrieval activation.
* **A-Anchored (Answer-Anchored):** The stable or rising high rates suggest that when anchored to a potential answer, the model maintains or even increases its expressed uncertainty throughout processing. This might reflect a more cautious verification process or difficulty reconciling the provided answer with internal knowledge.
* **Model Scale:** The more pronounced effects in the 3B model imply that increased model capacity amplifies these anchoring-dependent processing pathways.
* **Practical Implication:** The choice of prompting framework (Q-Anchored vs. A-Anchored) doesn't just change the final output; it fundamentally alters the model's internal confidence trajectory. This has significant implications for designing systems that rely on model uncertainty estimates, such as retrieval-augmented generation or abstention mechanisms. The charts argue that "uncertainty" is not a fixed property but a dynamic state heavily mediated by input format.
DECODING INTELLIGENCE...