## Line Graph: I-Don't-Know Rate Across Llama-3.2 Model Layers
### Overview
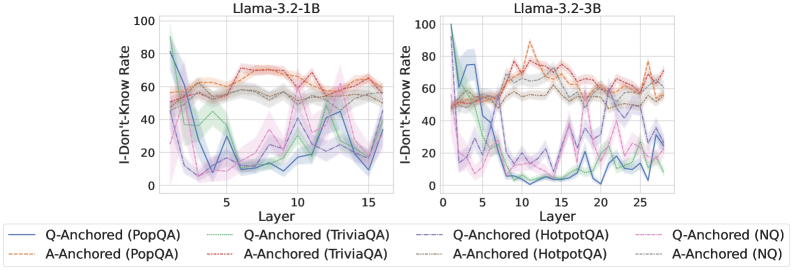
The image contains two side-by-side line graphs comparing the "I-Don't-Know Rate" (percentage of unanswered questions) across neural network layers for two versions of the Llama-3.2 model (1B and 3B parameter sizes). Each graph tracks performance across 15-25 layers, with multiple data series representing different question-answering (QA) datasets and anchoring methods.
### Components/Axes
- **X-axis**: Layer number (1-15 for 1B model, 0-25 for 3B model)
- **Y-axis**: I-Don't-Know Rate (%) (0-100 scale)
- **Legend**: Located at bottom-left of both graphs, with 8 entries:
- Solid lines: Q-Anchored methods
- Dashed lines: A-Anchored methods
- Colors correspond to specific QA datasets:
- Blue: PopQA
- Green: TriviaQA
- Purple: HotpotQA
- Red: NQ (Natural Questions)
### Detailed Analysis
#### Llama-3.2-1B (Left Graph)
- **Q-Anchored (PopQA)**: Starts at ~85% in layer 1, drops to ~30% by layer 5, fluctuates between 20-40% through layer 15
- **A-Anchored (PopQA)**: Peaks at ~70% in layer 3, declines to ~40% by layer 10, stabilizes at ~50%
- **Q-Anchored (TriviaQA)**: Sharp drop from 90% to 20% between layers 1-5, then oscillates between 15-35%
- **A-Anchored (TriviaQA)**: Gradual decline from 80% to 30% across all layers
- **Q-Anchored (HotpotQA)**: Starts at 75%, drops to 10% by layer 5, then fluctuates between 5-25%
- **A-Anchored (HotpotQA)**: Starts at 65%, declines to 20% by layer 10, then rises to 40% at layer 15
- **Q-Anchored (NQ)**: Peaks at 95% in layer 1, drops to 15% by layer 5, then fluctuates between 10-30%
#### Llama-3.2-3B (Right Graph)
- **Q-Anchored (PopQA)**: Starts at 90%, drops to 20% by layer 5, then fluctuates between 10-40%
- **A-Anchored (PopQA)**: Peaks at 80% in layer 3, declines to 30% by layer 10, then rises to 60% at layer 25
- **Q-Anchored (TriviaQA)**: Sharp drop from 85% to 10% between layers 1-5, then oscillates between 5-30%
- **A-Anchored (TriviaQA)**: Starts at 70%, declines to 20% by layer 15, then rises to 50% at layer 25
- **Q-Anchored (HotpotQA)**: Peaks at 95% in layer 1, drops to 5% by layer 5, then fluctuates between 2-20%
- **A-Anchored (HotpotQA)**: Starts at 60%, declines to 10% by layer 10, then rises to 70% at layer 25
- **Q-Anchored (NQ)**: Peaks at 98% in layer 1, drops to 12% by layer 5, then fluctuates between 8-35%
### Key Observations
1. **Model Size Impact**: The 3B model shows more pronounced fluctuations and higher peak rates compared to the 1B model
2. **Anchoring Method Differences**:
- Q-Anchored methods generally show steeper initial declines
- A-Anchored methods exhibit more gradual changes and later-stage increases
3. **Dataset Variability**:
- HotpotQA consistently shows the highest initial rates
- NQ demonstrates the most dramatic early drops
4. **Layer-Specific Patterns**:
- Layer 5 consistently shows the lowest rates across all datasets
- Layer 20 in the 3B model shows anomalous peaks for A-Anchored (HotpotQA) at ~70%
### Interpretation
The data suggests that:
1. **Model Complexity**: Larger models (3B) exhibit greater layer-to-layer variability in uncertainty, potentially indicating more complex internal representations
2. **Anchoring Strategy**:
- Q-Anchored methods may prioritize early-layer confidence building
- A-Anchored methods might maintain higher uncertainty in deeper layers before resolving
3. **Dataset Characteristics**:
- HotpotQA's complexity correlates with higher initial uncertainty
- NQ's structured format may enable faster confidence resolution
4. **Layer Dynamics**: The consistent drop at layer 5 across all datasets suggests a critical transition point in the model's processing pipeline
The graphs reveal that anchoring method selection significantly impacts uncertainty distribution across layers, with potential implications for model interpretability and question routing strategies.