## Heatmap: Model/Dataset Category Correlation
### Overview
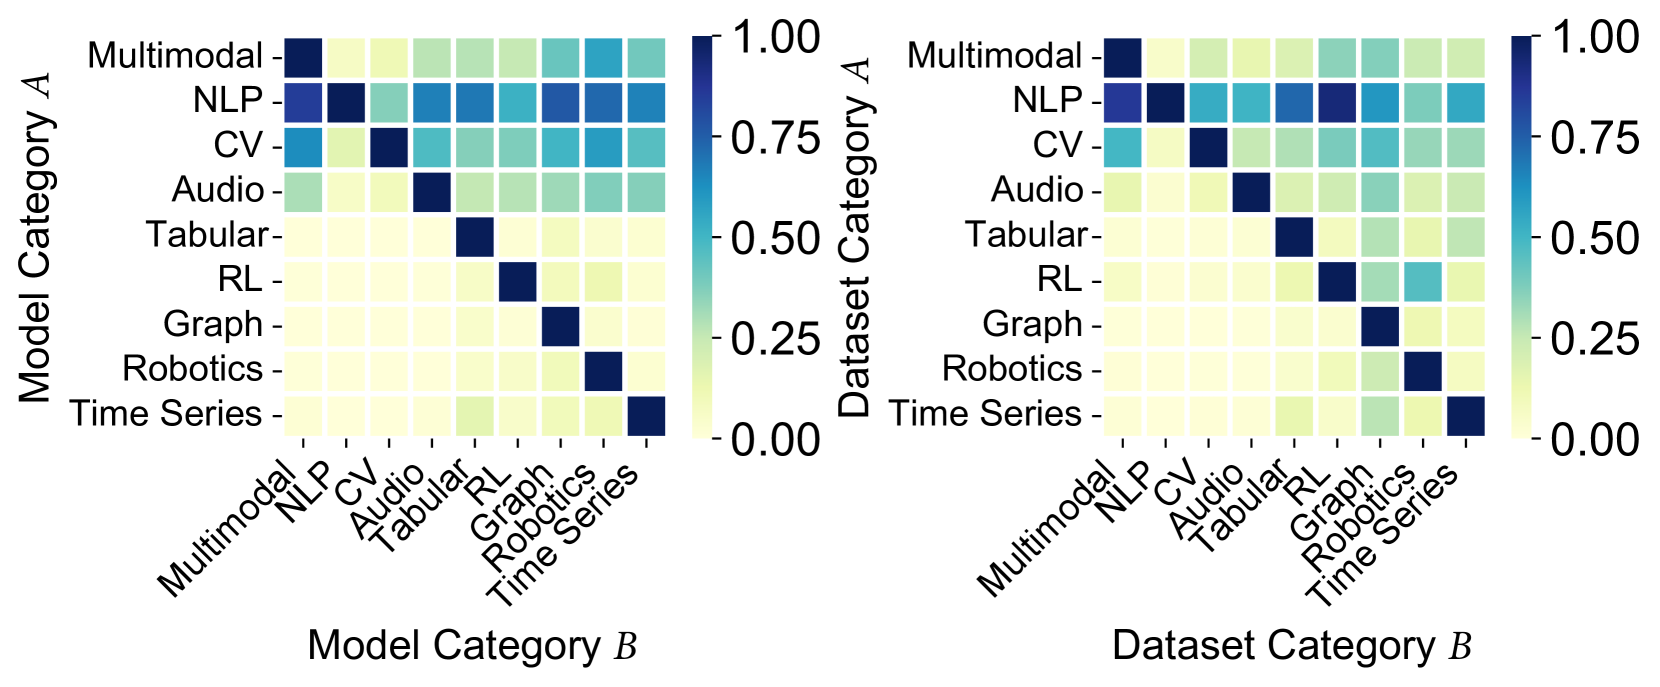
The image presents two heatmaps visualizing the correlation between different model categories and dataset categories. The left heatmap shows the correlation between "Model Category A" and "Model Category B," while the right heatmap shows the correlation between "Dataset Category A" and "Dataset Category B." The color intensity represents the strength of the correlation, ranging from yellow (low correlation) to dark blue (high correlation).
### Components/Axes
**Left Heatmap:**
* **Y-axis (Model Category A):**
* Categories: Multimodal, NLP, CV, Audio, Tabular, RL, Graph, Robotics, Time Series
* **X-axis (Model Category B):**
* Categories: Multimodal, NLP, CV, Audio, Tabular, RL, Graph, Robotics, Time Series
* **Color Scale:** Ranges from 0.00 (yellow) to 1.00 (dark blue), with increments of 0.25.
**Right Heatmap:**
* **Y-axis (Dataset Category A):**
* Categories: Multimodal, NLP, CV, Audio, Tabular, RL, Graph, Robotics, Time Series
* **X-axis (Dataset Category B):**
* Categories: Multimodal, NLP, CV, Audio, Tabular, RL, Graph, Robotics, Time Series
* **Color Scale:** Ranges from 0.00 (yellow) to 1.00 (dark blue), with increments of 0.25.
### Detailed Analysis
**Left Heatmap (Model Category A vs. Model Category B):**
* **Multimodal:** Shows high correlation (dark blue, ~0.75-1.00) with Multimodal, moderate correlation (blue, ~0.50-0.75) with NLP and CV, and low correlation (yellow, ~0.00-0.25) with the rest.
* **NLP:** Shows high correlation (dark blue, ~0.75-1.00) with NLP, moderate correlation (blue, ~0.50-0.75) with Multimodal and CV, and low correlation (yellow, ~0.00-0.25) with the rest.
* **CV:** Shows high correlation (dark blue, ~0.75-1.00) with CV, moderate correlation (blue, ~0.50-0.75) with Multimodal and NLP, and low correlation (yellow, ~0.00-0.25) with the rest.
* **Audio:** Shows high correlation (dark blue, ~0.75-1.00) with Audio, and low correlation (yellow, ~0.00-0.25) with the rest.
* **Tabular:** Shows high correlation (dark blue, ~0.75-1.00) with Tabular, and low correlation (yellow, ~0.00-0.25) with the rest.
* **RL:** Shows high correlation (dark blue, ~0.75-1.00) with RL, and low correlation (yellow, ~0.00-0.25) with the rest.
* **Graph:** Shows high correlation (dark blue, ~0.75-1.00) with Graph, and low correlation (yellow, ~0.00-0.25) with the rest.
* **Robotics:** Shows high correlation (dark blue, ~0.75-1.00) with Robotics, and low correlation (yellow, ~0.00-0.25) with the rest.
* **Time Series:** Shows high correlation (dark blue, ~0.75-1.00) with Time Series, and low correlation (yellow, ~0.00-0.25) with the rest.
**Right Heatmap (Dataset Category A vs. Dataset Category B):**
* **Multimodal:** Shows high correlation (dark blue, ~0.75-1.00) with Multimodal, moderate correlation (blue, ~0.50-0.75) with NLP and CV, and low correlation (yellow, ~0.00-0.25) with the rest.
* **NLP:** Shows high correlation (dark blue, ~0.75-1.00) with NLP, moderate correlation (blue, ~0.50-0.75) with Multimodal and CV, and low correlation (yellow, ~0.00-0.25) with the rest.
* **CV:** Shows high correlation (dark blue, ~0.75-1.00) with CV, moderate correlation (blue, ~0.50-0.75) with Multimodal and NLP, and low correlation (yellow, ~0.00-0.25) with the rest.
* **Audio:** Shows high correlation (dark blue, ~0.75-1.00) with Audio, and low correlation (yellow, ~0.00-0.25) with the rest.
* **Tabular:** Shows high correlation (dark blue, ~0.75-1.00) with Tabular, and low correlation (yellow, ~0.00-0.25) with the rest.
* **RL:** Shows high correlation (dark blue, ~0.75-1.00) with RL, and low correlation (yellow, ~0.00-0.25) with the rest.
* **Graph:** Shows high correlation (dark blue, ~0.75-1.00) with Graph, and low correlation (yellow, ~0.00-0.25) with the rest.
* **Robotics:** Shows high correlation (dark blue, ~0.75-1.00) with Robotics, and low correlation (yellow, ~0.00-0.25) with the rest.
* **Time Series:** Shows high correlation (dark blue, ~0.75-1.00) with Time Series, and low correlation (yellow, ~0.00-0.25) with the rest.
### Key Observations
* Both heatmaps exhibit a strong diagonal pattern, indicating a high correlation between the same categories (e.g., Multimodal models are highly correlated with Multimodal models, and Multimodal datasets are highly correlated with Multimodal datasets).
* Multimodal, NLP, and CV categories show some degree of inter-correlation in both heatmaps.
* The remaining categories (Audio, Tabular, RL, Graph, Robotics, Time Series) show very little correlation with each other.
### Interpretation
The heatmaps suggest that models and datasets within the same category are strongly related. This is expected, as models are typically designed and trained for specific data types. The inter-correlation between Multimodal, NLP, and CV categories might indicate that these areas share some common techniques or are often used together in certain applications. The lack of correlation between the other categories suggests that they are more specialized and distinct from each other. The data demonstrates the expected relationships between model and dataset categories, highlighting the importance of matching models to appropriate data types.