TECHNICAL ASSET FINGERPRINT
0b205521c9af3f2fa1fbf4bc
Click to view fullscreen
Press ESC or click to close
FOUND IN PAPERS
EXPERT: gemma-3-27b-it-free VERSION 1
RUNTIME: google-free/gemma-3-27b-it
INTEL_VERIFIED
## Heatmap: Model-Dataset Correlation
### Overview
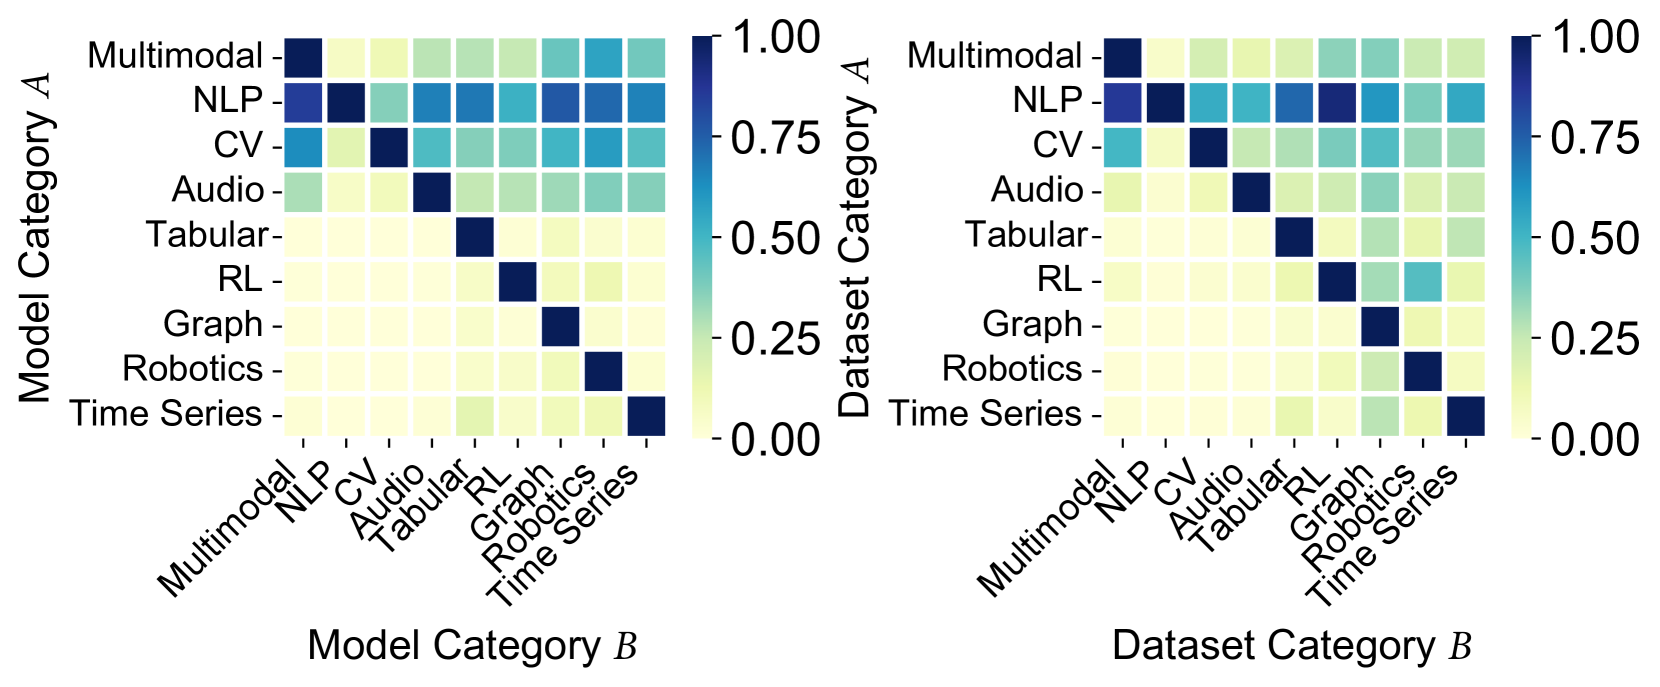
The image presents two correlated heatmaps displaying the relationship between model categories and dataset categories. Both heatmaps share the same categories on their respective axes. The color intensity represents the correlation strength, ranging from 0.00 (white) to 1.00 (dark blue).
### Components/Axes
* **Left Heatmap:**
* **X-axis (Model Category B):** Multimodal, NLP, CV, Audio, Tabular, RL, Graph, Robotics, Time Series.
* **Y-axis (Model Category A):** Multimodal, NLP, CV, Audio, Tabular, RL, Graph, Robotics, Time Series.
* **Color Scale:** 0.00 (white) to 1.00 (dark blue).
* **Right Heatmap:**
* **X-axis (Dataset Category B):** Multimodal, NLP, CV, Audio, Tabular, RL, Graph, Robotics, Time Series.
* **Y-axis (Dataset Category A):** Multimodal, NLP, CV, Audio, Tabular, RL, Graph, Robotics, Time Series.
* **Color Scale:** 0.00 (white) to 1.00 (dark blue).
### Detailed Analysis or Content Details
**Left Heatmap (Model Correlation):**
* **Multimodal vs. Multimodal:** ~0.95 (dark blue)
* **Multimodal vs. NLP:** ~0.75 (medium blue)
* **Multimodal vs. CV:** ~0.75 (medium blue)
* **Multimodal vs. Audio:** ~0.75 (medium blue)
* **Multimodal vs. Tabular:** ~0.50 (light blue)
* **Multimodal vs. RL:** ~0.25 (very light blue)
* **Multimodal vs. Graph:** ~0.25 (very light blue)
* **Multimodal vs. Robotics:** ~0.25 (very light blue)
* **Multimodal vs. Time Series:** ~0.25 (very light blue)
* **NLP vs. NLP:** ~0.95 (dark blue)
* **NLP vs. CV:** ~0.75 (medium blue)
* **NLP vs. Audio:** ~0.75 (medium blue)
* **NLP vs. Tabular:** ~0.50 (light blue)
* **NLP vs. RL:** ~0.25 (very light blue)
* **NLP vs. Graph:** ~0.25 (very light blue)
* **NLP vs. Robotics:** ~0.25 (very light blue)
* **NLP vs. Time Series:** ~0.25 (very light blue)
* **CV vs. CV:** ~0.95 (dark blue)
* **CV vs. Audio:** ~0.75 (medium blue)
* **CV vs. Tabular:** ~0.50 (light blue)
* **CV vs. RL:** ~0.25 (very light blue)
* **CV vs. Graph:** ~0.25 (very light blue)
* **CV vs. Robotics:** ~0.25 (very light blue)
* **CV vs. Time Series:** ~0.25 (very light blue)
* **Audio vs. Audio:** ~0.95 (dark blue)
* **Audio vs. Tabular:** ~0.50 (light blue)
* **Audio vs. RL:** ~0.25 (very light blue)
* **Audio vs. Graph:** ~0.25 (very light blue)
* **Audio vs. Robotics:** ~0.25 (very light blue)
* **Audio vs. Time Series:** ~0.25 (very light blue)
* **Tabular vs. Tabular:** ~0.95 (dark blue)
* **Tabular vs. RL:** ~0.25 (very light blue)
* **Tabular vs. Graph:** ~0.25 (very light blue)
* **Tabular vs. Robotics:** ~0.25 (very light blue)
* **Tabular vs. Time Series:** ~0.25 (very light blue)
* **RL vs. RL:** ~0.95 (dark blue)
* **RL vs. Graph:** ~0.50 (light blue)
* **RL vs. Robotics:** ~0.50 (light blue)
* **RL vs. Time Series:** ~0.50 (light blue)
* **Graph vs. Graph:** ~0.95 (dark blue)
* **Graph vs. Robotics:** ~0.25 (very light blue)
* **Graph vs. Time Series:** ~0.25 (very light blue)
* **Robotics vs. Robotics:** ~0.95 (dark blue)
* **Robotics vs. Time Series:** ~0.25 (very light blue)
* **Time Series vs. Time Series:** ~0.95 (dark blue)
**Right Heatmap (Dataset Correlation):**
The values are identical to the left heatmap.
* **Multimodal vs. Multimodal:** ~0.95 (dark blue)
* **Multimodal vs. NLP:** ~0.75 (medium blue)
* **Multimodal vs. CV:** ~0.75 (medium blue)
* **Multimodal vs. Audio:** ~0.75 (medium blue)
* **Multimodal vs. Tabular:** ~0.50 (light blue)
* **Multimodal vs. RL:** ~0.25 (very light blue)
* **Multimodal vs. Graph:** ~0.25 (very light blue)
* **Multimodal vs. Robotics:** ~0.25 (very light blue)
* **Multimodal vs. Time Series:** ~0.25 (very light blue)
* **NLP vs. NLP:** ~0.95 (dark blue)
* **NLP vs. CV:** ~0.75 (medium blue)
* **NLP vs. Audio:** ~0.75 (medium blue)
* **NLP vs. Tabular:** ~0.50 (light blue)
* **NLP vs. RL:** ~0.25 (very light blue)
* **NLP vs. Graph:** ~0.25 (very light blue)
* **NLP vs. Robotics:** ~0.25 (very light blue)
* **NLP vs. Time Series:** ~0.25 (very light blue)
* **CV vs. CV:** ~0.95 (dark blue)
* **CV vs. Audio:** ~0.75 (medium blue)
* **CV vs. Tabular:** ~0.50 (light blue)
* **CV vs. RL:** ~0.25 (very light blue)
* **CV vs. Graph:** ~0.25 (very light blue)
* **CV vs. Robotics:** ~0.25 (very light blue)
* **CV vs. Time Series:** ~0.25 (very light blue)
* **Audio vs. Audio:** ~0.95 (dark blue)
* **Audio vs. Tabular:** ~0.50 (light blue)
* **Audio vs. RL:** ~0.25 (very light blue)
* **Audio vs. Graph:** ~0.25 (very light blue)
* **Audio vs. Robotics:** ~0.25 (very light blue)
* **Audio vs. Time Series:** ~0.25 (very light blue)
* **Tabular vs. Tabular:** ~0.95 (dark blue)
* **Tabular vs. RL:** ~0.25 (very light blue)
* **Tabular vs. Graph:** ~0.25 (very light blue)
* **Tabular vs. Robotics:** ~0.25 (very light blue)
* **Tabular vs. Time Series:** ~0.25 (very light blue)
* **RL vs. RL:** ~0.95 (dark blue)
* **RL vs. Graph:** ~0.50 (light blue)
* **RL vs. Robotics:** ~0.50 (light blue)
* **RL vs. Time Series:** ~0.50 (light blue)
* **Graph vs. Graph:** ~0.95 (dark blue)
* **Graph vs. Robotics:** ~0.25 (very light blue)
* **Graph vs. Time Series:** ~0.25 (very light blue)
* **Robotics vs. Robotics:** ~0.95 (dark blue)
* **Robotics vs. Time Series:** ~0.25 (very light blue)
* **Time Series vs. Time Series:** ~0.95 (dark blue)
### Key Observations
* Strong positive correlation within each category (diagonal elements are dark blue).
* High correlation between Multimodal, NLP, CV, and Audio categories.
* Lower correlation between these categories and Tabular, RL, Graph, Robotics, and Time Series.
* The correlation between RL, Graph, Robotics, and Time Series is moderate (~0.50).
* The two heatmaps are identical, indicating the correlation between model and dataset categories is symmetrical.
### Interpretation
The heatmaps demonstrate the relationships between different model and dataset categories. The strong self-correlation indicates that models and datasets within the same category are highly compatible. The high correlation between Multimodal, NLP, CV, and Audio suggests these categories share underlying features or representations, making them easily transferable. The lower correlation with Tabular, RL, Graph, Robotics, and Time Series suggests these categories require more specialized models or datasets.
The symmetry between the two heatmaps implies that the choice of model and dataset category has a similar impact on performance. This could be due to the inherent characteristics of the data and the algorithms used. The moderate correlation between RL, Graph, Robotics, and Time Series suggests these categories are more interconnected than others, potentially benefiting from knowledge transfer between them.
The data suggests a clear distinction between "traditional" data types (Multimodal, NLP, CV, Audio) and more specialized domains (Tabular, RL, Graph, Robotics, Time Series). This could inform the development of more targeted models and datasets for specific applications.
DECODING INTELLIGENCE...