\n
## Heatmap Comparison: Model Category vs. Dataset Category Compatibility
### Overview
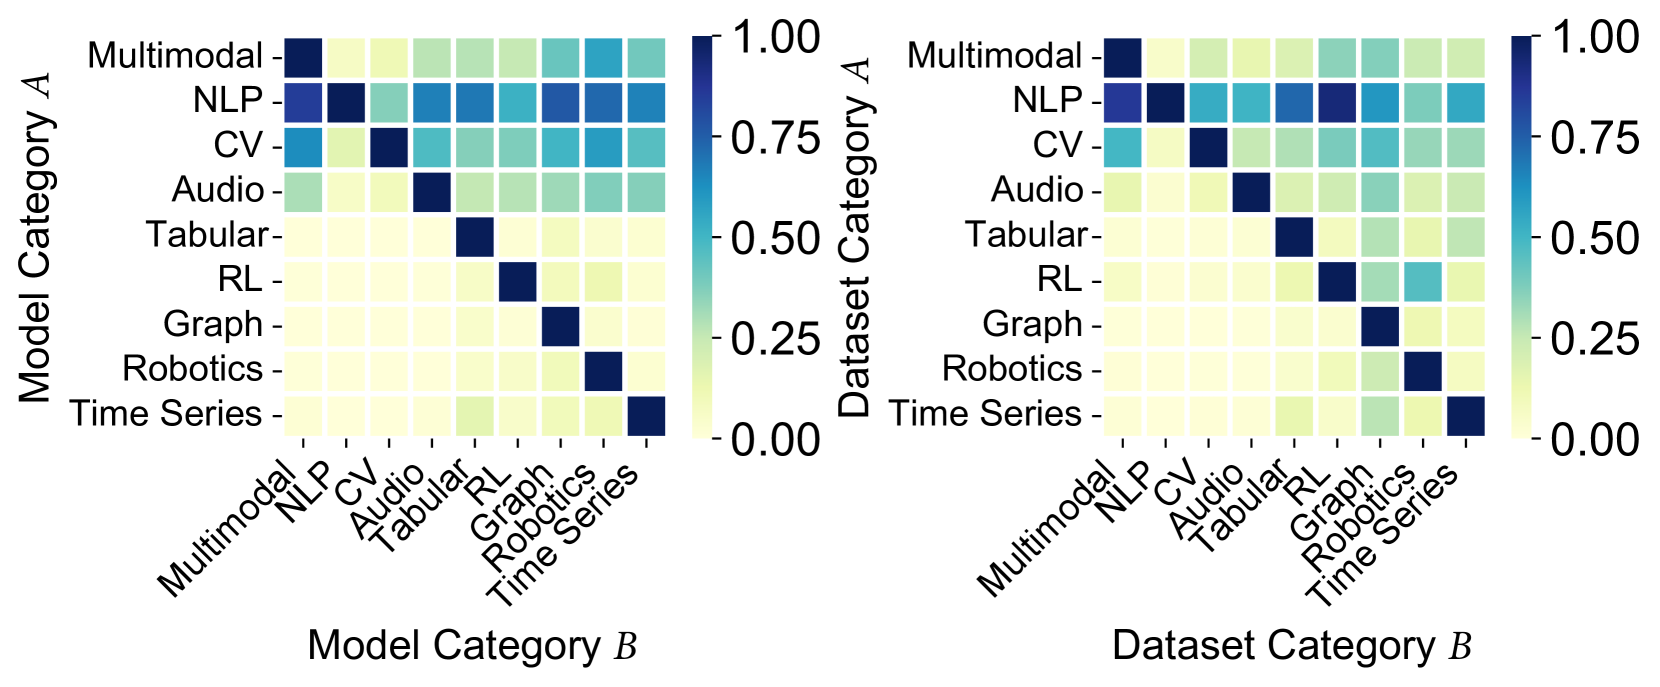
The image displays two side-by-side heatmaps visualizing compatibility or similarity scores between different categories in the field of artificial intelligence and machine learning. The left heatmap compares "Model Category A" against "Model Category B," while the right heatmap compares "Dataset Category A" against "Dataset Category B." Both use an identical color scale ranging from 0.00 (light yellow) to 1.00 (dark blue), where darker blue indicates higher compatibility or similarity.
### Components/Axes
**Left Heatmap: Model Category Compatibility**
* **Y-Axis (Vertical):** Labeled "Model Category A". Categories from top to bottom: Multimodal, NLP, CV, Audio, Tabular, RL, Graph, Robotics, Time Series.
* **X-Axis (Horizontal):** Labeled "Model Category B". Categories from left to right: Multimodal, NLP, CV, Audio, Tabular, RL, Graph, Robotics, Time Series.
* **Color Bar:** Positioned to the right of the heatmap. Scale from 0.00 (light yellow) to 1.00 (dark blue), with intermediate ticks at 0.25, 0.50, and 0.75.
**Right Heatmap: Dataset Category Compatibility**
* **Y-Axis (Vertical):** Labeled "Dataset Category A". Categories from top to bottom: Multimodal, NLP, CV, Audio, Tabular, RL, Graph, Robotics, Time Series.
* **X-Axis (Horizontal):** Labeled "Dataset Category B". Categories from left to right: Multimodal, NLP, CV, Audio, Tabular, RL, Graph, Robotics, Time Series.
* **Color Bar:** Positioned to the right of the heatmap. Identical scale and labeling to the left heatmap's color bar.
### Detailed Analysis
**Left Heatmap (Model Category):**
* **Diagonal Trend:** The cells along the main diagonal (where Model Category A and B are the same) are uniformly dark blue, indicating a perfect or very high compatibility score (~1.00) within the same model category.
* **Top Rows (Multimodal, NLP, CV):** These rows show significant blue and teal coloring across many columns, suggesting these model categories have relatively high compatibility with a wide range of other model categories. The "NLP" row, in particular, shows strong blue cells intersecting with "Multimodal," "CV," "Audio," and "Time Series."
* **Middle/Bottom Rows (Audio, Tabular, RL, Graph, Robotics, Time Series):** These rows are predominantly light yellow to light green, indicating lower compatibility scores with most other categories. The primary exceptions are their strong diagonal matches and occasional moderate compatibility (teal/green) with categories like "Multimodal" or "NLP."
* **Notable Cluster:** There is a cluster of moderate-to-high compatibility (teal/blue) in the top-left 3x3 block involving Multimodal, NLP, and CV models interacting with each other.
**Right Heatmap (Dataset Category):**
* **Diagonal Trend:** Similar to the left heatmap, the main diagonal cells are dark blue, indicating high compatibility within the same dataset category.
* **Overall Pattern:** This heatmap appears more uniform and less contrasted than the left one. Most off-diagonal cells are light yellow or very light green, suggesting generally lower cross-category compatibility for datasets compared to models.
* **Exceptions:** The "NLP" dataset category row shows moderate compatibility (teal) with "Multimodal," "CV," and "Time Series" datasets. The "RL" row shows a notable teal cell at the intersection with "Time Series."
* **Contrast with Left Heatmap:** The top rows (Multimodal, NLP, CV) do not show the same broad, high-compatibility pattern seen in the model heatmap. Cross-category compatibility for datasets appears more restricted.
### Key Observations
1. **Strong Diagonal:** Both heatmaps exhibit a perfect or near-perfect diagonal, confirming that models/datasets are most compatible with their own category.
2. **Model vs. Dataset Generalization:** Model categories (left) show significantly higher off-diagonal compatibility, especially among Multimodal, NLP, and CV. This suggests models trained in one of these areas may transfer or be compatible with tasks/data from the others more readily.
3. **Dataset Specificity:** Dataset categories (right) show lower cross-compatibility, implying that datasets are more specialized and less interchangeable across different AI domains.
4. **NLP as a Hub:** In both heatmaps, the NLP category (both model and dataset) acts as a relative "hub," showing moderate compatibility with several other categories.
5. **Specialized Categories:** Categories like Tabular, RL, Graph, and Robotics show high specificity (dark diagonal) but low cross-compatibility (light off-diagonal cells) in both models and datasets.
### Interpretation
This visualization likely represents a transfer learning or compatibility matrix. The data suggests a fundamental difference in how AI models and datasets generalize across domains.
* **Models are more generalizable:** The left heatmap indicates that certain model architectures (particularly those for Multimodal, NLP, and CV tasks) have learned representations that are useful across a broader spectrum of problems. This aligns with the trend of foundation models and transfer learning.
* **Datasets are more specialized:** The right heatmap suggests that datasets are inherently tied to their specific domain. A dataset for Reinforcement Learning (RL) is not easily used for a Computer Vision (CV) task, and vice-versa, due to fundamental differences in data structure and content.
* **Implication for AI Development:** The contrast highlights that while we can build models that work across domains, we still rely heavily on domain-specific data to train and evaluate them. The "NLP hub" phenomenon might reflect the pervasive use of text data or language-based instructions across many AI applications.
* **Anomaly/Outlier:** The relatively higher compatibility between "RL" models/datasets and "Time Series" models/datasets is an interesting outlier, possibly pointing to shared sequential decision-making or temporal pattern recognition components.
**Language Note:** All text in the image is in English.