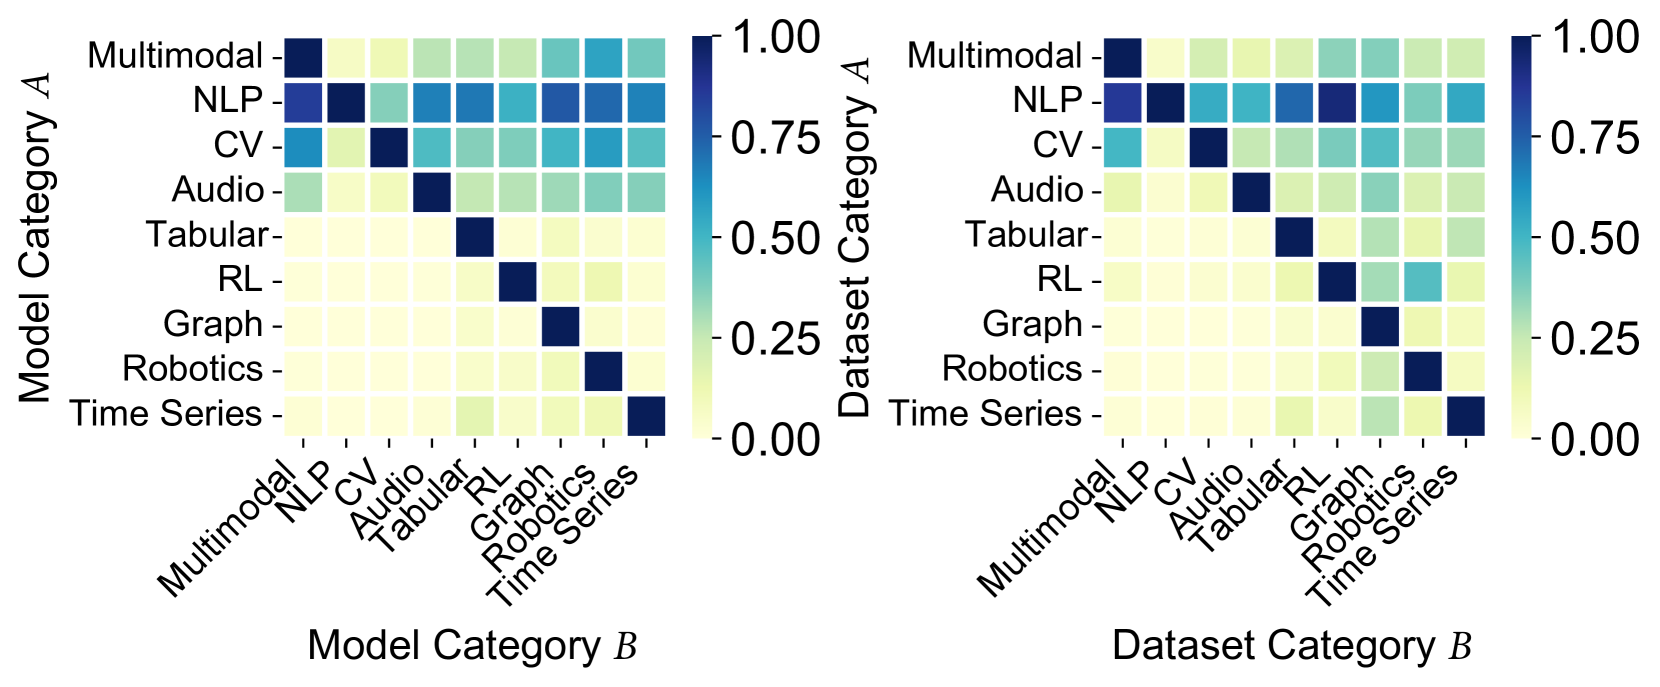
## Heatmap: Model-Dataset Category Similarity
### Overview
The image contains two side-by-side heatmaps comparing model and dataset category compatibility. Each panel uses a color gradient (0.00-1.00) to represent similarity scores between model categories (y-axis) and dataset categories (x-axis). The left panel focuses on "Model Category A" relationships, while the right panel examines "Dataset Category B" relationships.
### Components/Axes
**Left Panel (Model Category A):**
- **Y-axis (Model Category A):** Multimodal, NLP, CV, Audio, Tabular, RL, Graph, Robotics, Time Series
- **X-axis (Model Category B):** Same categories as Y-axis
- **Legend:** Color scale from 0.00 (light yellow) to 1.00 (dark blue)
- **Title:** "Model Category A"
**Right Panel (Dataset Category B):**
- **Y-axis (Model Category A):** Same as left panel
- **X-axis (Dataset Category B):** Multimodal, NLP, CV, Audio, Tabular, RL, Graph, Robotics, Time Series
- **Legend:** Identical color scale to left panel
- **Title:** "Dataset Category B"
### Detailed Analysis
**Left Panel Patterns:**
1. **Diagonal Dominance:** Dark blue cells (1.00) along the diagonal confirm perfect category matching
2. **Strongest Cross-Category:** NLP-Audio (0.75) and CV-Tabular (0.75) show high similarity
3. **Weakest Links:** Graph-Robotics (0.00) and Robotics-Graph (0.00) indicate no compatibility
**Right Panel Patterns:**
1. **Diagonal Consistency:** Maintains 1.00 scores for matching categories
2. **Notable Cross-Category:** RL-Time Series (0.50) and Graph-Robotics (0.50) show moderate compatibility
3. **Weakest Links:** Tabular-Audio (0.00) and Audio-Tabular (0.00) show no compatibility
### Key Observations
1. **Diagonal Dominance:** Both panels show perfect 1.00 scores along the diagonal, confirming optimal category matching
2. **Cross-Category Patterns:**
- NLP demonstrates strongest cross-category performance (0.75 with Audio in left panel)
- RL shows notable Time Series compatibility (0.50 in right panel)
- Graph-Robotics relationship shows mutual 0.50 compatibility in right panel
3. **Zero-Compatibility Pairs:**
- Graph-Robotics (left panel)
- Tabular-Audio (right panel)
- Robotics-Graph (left panel)
### Interpretation
The heatmaps reveal a clear preference for category-matched model-dataset pairs, with diagonal dominance indicating optimal performance. However, several cross-category compatibilities suggest:
1. **Model Adaptability:** NLP's high Audio similarity (0.75) implies text models can handle audio data through feature extraction
2. **Temporal Relationships:** RL's 0.50 Time Series compatibility suggests reinforcement learning can handle sequential data with moderate effectiveness
3. **Structural Similarities:** Graph-Robotics 0.50 compatibility in the right panel indicates shared structural properties between these categories
4. **Data Type Barriers:** Zero scores for Tabular-Audio and Graph-Robotics in left panel highlight fundamental differences between tabular/audio and graph/robotics data types
The consistent diagonal dominance across both panels emphasizes the importance of category alignment, while the notable cross-category scores suggest opportunities for transfer learning and multi-modal approaches. The absence of certain cross-category compatibilities (e.g., Graph-Robotics in left panel) indicates potential architectural limitations in handling fundamentally different data structures.