## Heatmap: Model Performance Across Context Length and Answer Depth
### Overview
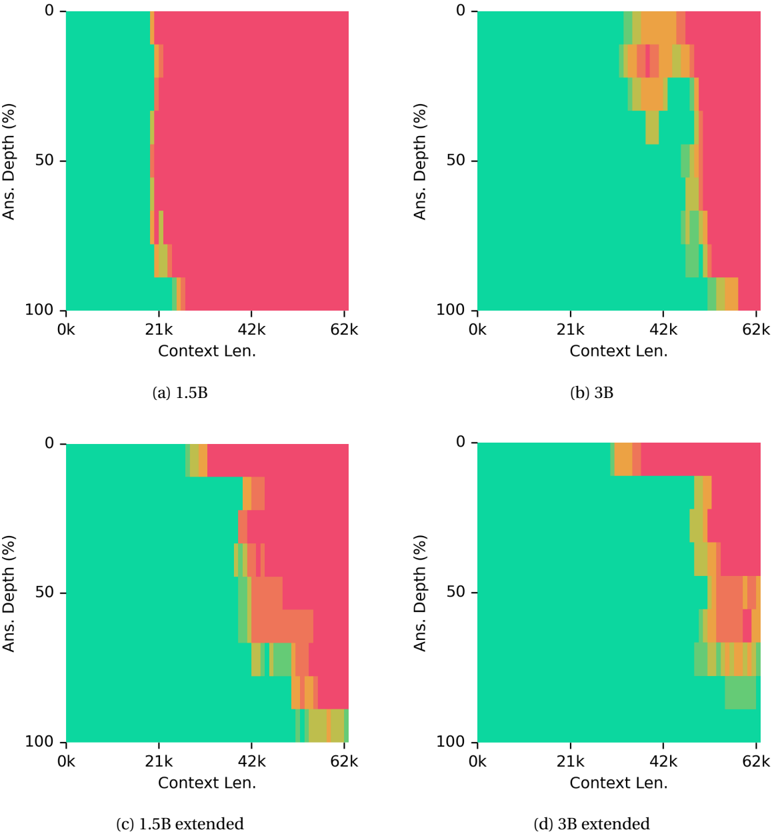
The image contains four heatmaps comparing model performance across varying context lengths (0k–62k tokens) and answer depths (0%–100%). Each subplot corresponds to a different model configuration: (a) 1.5B, (b) 3B, (c) 1.5B extended, and (d) 3B extended. Colors transition from green (high performance) to yellow (moderate) to red (low), indicating metric degradation.
---
### Components/Axes
- **X-axis (Context Len.)**: Ranges from 0k to 62k tokens in increments of ~21k.
- **Y-axis (Ans. Depth %)**: Ranges from 0% to 100% in 50% increments.
- **Color Gradient**:
- Green: High performance (likely accuracy/precision).
- Yellow: Moderate performance.
- Red: Low performance.
- **Subplot Labels**:
- (a) 1.5B
- (b) 3B
- (c) 1.5B extended
- (d) 3B extended
---
### Detailed Analysis
#### (a) 1.5B Model
- **Green Dominance**: Left 70% of the heatmap (0k–21k context) is predominantly green, indicating stable performance at shorter contexts.
- **Yellow Stripe**: A vertical yellow band (~21k–42k context) marks a performance drop.
- **Red Zone**: Rightmost 20% (42k–62k context) is red, showing severe degradation at long contexts.
#### (b) 3B Model
- **Green Dominance**: Similar to 1.5B but with a narrower green zone (0k–21k).
- **Yellow Stripe**: Broader yellow band (~21k–42k) compared to 1.5B.
- **Red Zone**: Red area starts earlier (~42k) but covers less vertical space than 1.5B.
#### (c) 1.5B Extended
- **Green Dominance**: Slightly reduced green zone (0k–21k) compared to base 1.5B.
- **Yellow Stripe**: Wider yellow band (~21k–42k) with horizontal yellow streaks at 50% and 75% answer depths.
- **Red Zone**: Red area starts at 42k but extends vertically to 100% answer depth.
#### (d) 3B Extended
- **Green Dominance**: Minimal green (0k–21k) with a thin yellow stripe.
- **Yellow Stripe**: Dominates 21k–42k context, with red streaks at 50% and 75% answer depths.
- **Red Zone**: Largest red area (42k–62k context, 50%–100% answer depth), indicating severe performance collapse.
---
### Key Observations
1. **Threshold at 21k Context**: All models show a performance drop starting at ~21k tokens, marked by yellow bands.
2. **Extended Models Degrade Faster**:
- 1.5B extended shows broader yellow/red zones than base 1.5B.
- 3B extended has the most severe degradation (largest red zone).
3. **Answer Depth Correlation**:
- Red zones expand vertically at higher answer depths (50%–100%), suggesting performance worsens with deeper reasoning.
4. **Color Consistency**: Green/yellow/red gradients align across subplots, confirming metric uniformity.
---
### Interpretation
- **Context Length Limitation**: The ~21k token threshold likely reflects hardware or architectural constraints (e.g., attention mechanisms in transformers).
- **Model Scaling Trade-offs**: Larger models (3B) handle shorter contexts better but fail catastrophically at longer contexts compared to smaller models (1.5B).
- **Extended Model Risks**: Extended variants (c, d) exhibit amplified degradation, possibly due to increased complexity or training instability.
- **Answer Depth Sensitivity**: Performance drops more sharply at higher answer depths, implying that complex reasoning tasks are more affected by context length limitations.
This data highlights the trade-off between model size, context handling, and task complexity. Extended models may prioritize capacity over stability, making them less reliable for long-context tasks.