# Technical Data Extraction: Weekly Active Users and Coverage Rate
## 1. Document Overview
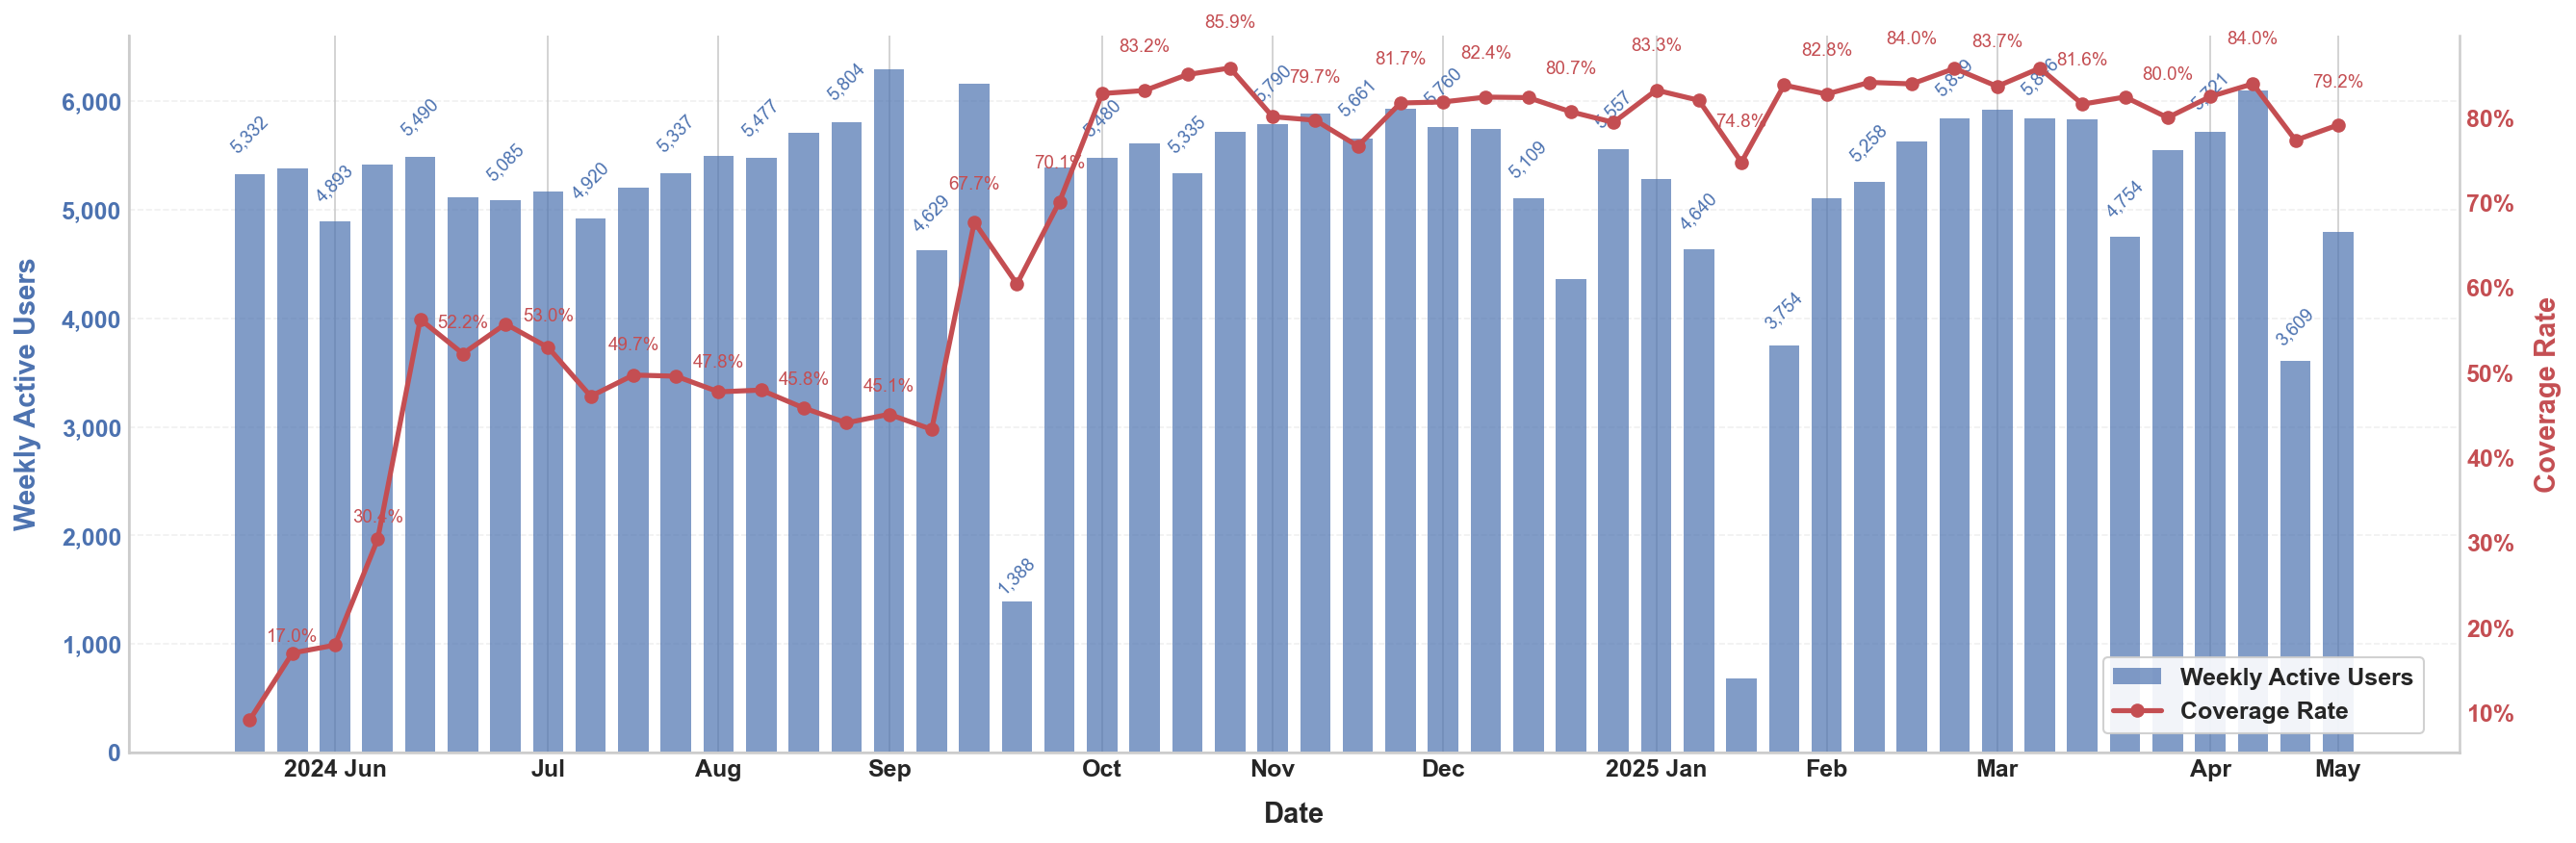
This image is a dual-axis combination chart (bar and line) tracking user engagement metrics over a period of approximately one year, from June 2024 to May 2025.
## 2. Chart Components and Metadata
### Axis Definitions
* **Primary Y-Axis (Left):** Weekly Active Users (WAU).
* **Color:** Blue
* **Scale:** 0 to 6,000 (increments of 1,000).
* **Secondary Y-Axis (Right):** Coverage Rate.
* **Color:** Red/Maroon
* **Scale:** 10% to 80%+ (increments of 10%).
* **X-Axis (Bottom):** Date (Monthly intervals).
* **Range:** June 2024 through May 2025.
### Legend [Location: Bottom Right]
* **Blue Bar:** Weekly Active Users
* **Red Line with Markers:** Coverage Rate
---
## 3. Data Series Analysis
### Series 1: Weekly Active Users (Blue Bars)
**Trend Analysis:** The WAU remains relatively stable between 5,000 and 6,000 for most of the year. There are significant "dips" or outliers in late September/early October 2024 and late January 2025, where activity drops sharply before recovering.
**Extracted Data Points:**
| Month | Weekly Active Users (WAU) |
| :--- | :--- |
| **Jun 2024** | 5,332; 4,893; 5,490 |
| **Jul 2024** | 5,085; 4,920 |
| **Aug 2024** | 5,337; 5,477 |
| **Sep 2024** | 5,804; 4,629 |
| **Oct 2024** | 1,388; 5,480; 5,335 |
| **Nov 2024** | 5,790; 5,661 |
| **Dec 2024** | 5,760; 5,109 |
| **Jan 2025** | 5,557; 4,640; ~700 |
| **Feb 2025** | 3,754; 5,258 |
| **Mar 2025** | 5,839; 5,816 |
| **Apr 2025** | 4,754; 5,721 |
| **May 2025** | 3,609; ~4,800 |
### Series 2: Coverage Rate (Red Line)
**Trend Analysis:** The Coverage Rate shows a sharp upward trajectory in the first quarter (June - Oct 2024), starting below 20% and climbing to a plateau. From October 2024 onwards, the rate stabilizes and fluctuates within a high range of 75% to 85%.
**Extracted Data Points:**
| Month | Coverage Rate (%) |
| :--- | :--- |
| **Jun 2024** | 17.0%; 30.4% |
| **Jul 2024** | 52.2%; 53.0% |
| **Aug 2024** | 49.7%; 47.8% |
| **Sep 2024** | 45.8%; 45.1%; 67.7% |
| **Oct 2024** | 70.1%; 83.2%; 85.9% |
| **Nov 2024** | 79.7%; 81.7% |
| **Dec 2024** | 82.4%; 80.7% |
| **Jan 2025** | 83.3%; 74.8% |
| **Feb 2025** | 82.8%; 84.0% |
| **Mar 2025** | 83.7%; 81.6% |
| **Apr 2025** | 80.0%; 84.0% |
| **May 2025** | 79.2% |
---
## 4. Key Observations
1. **Growth Phase:** Between June 2024 and October 2024, the Coverage Rate more than quadrupled (from 17% to over 80%), while WAU remained largely consistent. This suggests a successful rollout or adoption phase among the existing user base.
2. **Anomalies:**
* The sharp drop in WAU in **October 2024 (1,388)** corresponds with a sharp *increase* in Coverage Rate (70.1%), suggesting a possible change in how "Active Users" were defined or a technical reporting error that didn't affect the coverage calculation.
* The drop in **late January 2025** shows a near-total loss of WAU for one week, followed by a recovery.
3. **Correlation:** Post-October 2024, the Coverage Rate is decoupled from WAU volume; even when WAU fluctuates significantly (e.g., Feb 2025), the Coverage Rate remains steady above 75%.