## Line Charts: Attention Weights with and without Meaningless Tokens
### Overview
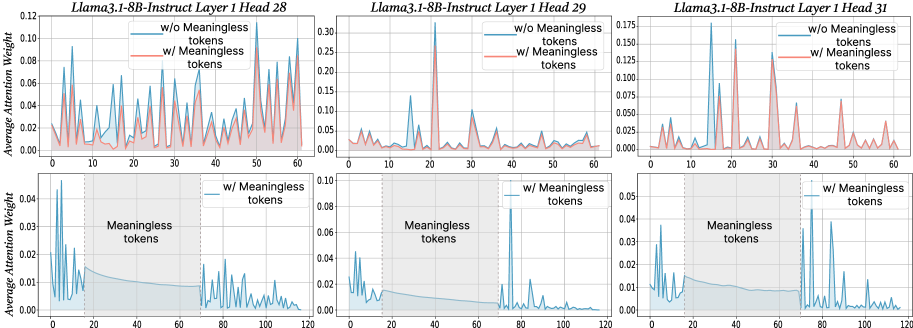
The image presents six line charts arranged in two rows of three. Each chart displays the average attention weight across different tokens for the Llama3.1-8B-Instruct model, specifically focusing on Layer 1, Heads 28, 29, and 31. The top row shows attention weights for all tokens, distinguishing between scenarios "w/o Meaningless tokens" (blue line) and "w/ Meaningless tokens" (red line). The bottom row focuses on the attention weights "w/ Meaningless tokens" (blue line) and highlights the region where meaningless tokens are present with a shaded gray area.
### Components/Axes
**General Chart Elements:**
* **Titles:** Each chart has a title indicating the model, layer, and head number (e.g., "Llama3.1-8B-Instruct Layer 1 Head 28").
* **X-axis:** Represents the token index. The top row charts range from 0 to 60, while the bottom row charts range from 0 to 120.
* **Y-axis:** Represents the "Average Attention Weight." The scale varies between charts.
* **Legends:** Each chart contains a legend in the top-right corner. The top row legends indicate "w/o Meaningless tokens" (blue line) and "w/ Meaningless tokens" (red line). The bottom row legends indicate "w/ Meaningless tokens" (blue line).
* **Shaded Region:** The bottom row charts feature a shaded gray region labeled "Meaningless tokens." This region spans approximately from token index 20 to 70.
* **Vertical Dashed Line:** The bottom row charts have a vertical dashed line at approximately token index 20, marking the start of the "Meaningless tokens" region.
**Specific Chart Details:**
* **Top Row Charts:**
* **Y-axis Scale:**
* Head 28: 0.00 to 0.12
* Head 29: 0.00 to 0.30
* Head 31: 0.000 to 0.175
* **Bottom Row Charts:**
* **Y-axis Scale:**
* Head 28: 0.00 to 0.04
* Head 29: 0.00 to 0.10
* Head 31: 0.00 to 0.05
### Detailed Analysis
**Head 28 (Top Row):**
* **Blue Line (w/o Meaningless tokens):** Shows several peaks, with the highest around token index 22, reaching approximately 0.11. The line fluctuates significantly.
* **Red Line (w/ Meaningless tokens):** Generally follows the trend of the blue line but with lower peaks. It remains mostly below 0.04.
**Head 28 (Bottom Row):**
* **Blue Line (w/ Meaningless tokens):** Shows high attention weights for the first few tokens, peaking at approximately 0.04 around token index 2. The attention weight decreases and remains low within the "Meaningless tokens" region (token index 20 to 70), then increases again after token index 70.
**Head 29 (Top Row):**
* **Blue Line (w/o Meaningless tokens):** Exhibits a very sharp peak at token index 22, reaching approximately 0.30. The rest of the line remains relatively low, generally below 0.05.
* **Red Line (w/ Meaningless tokens):** Similar to the blue line, but the peak at token index 22 is lower, around 0.25.
**Head 29 (Bottom Row):**
* **Blue Line (w/ Meaningless tokens):** Shows a high peak at the beginning, around token index 2, reaching approximately 0.05. The attention weight decreases and remains low within the "Meaningless tokens" region, then increases again after token index 70.
**Head 31 (Top Row):**
* **Blue Line (w/o Meaningless tokens):** Shows several prominent peaks, particularly around token indices 17 and 30, reaching approximately 0.17 and 0.15, respectively.
* **Red Line (w/ Meaningless tokens):** Generally follows the trend of the blue line, but with lower peaks.
**Head 31 (Bottom Row):**
* **Blue Line (w/ Meaningless tokens):** Shows high attention weights for the first few tokens, peaking at approximately 0.05 around token index 2. The attention weight decreases and remains low within the "Meaningless tokens" region, then increases again after token index 70.
### Key Observations
* The presence of meaningless tokens generally reduces the average attention weight, as evidenced by the red lines being lower than the blue lines in the top row charts.
* The bottom row charts clearly show a suppression of attention weights within the "Meaningless tokens" region (token index 20 to 70).
* Heads 29 exhibits a very strong focus on a single token (index 22) when meaningless tokens are excluded.
* The attention weights tend to be higher for the initial tokens (before index 20) and after the "Meaningless tokens" region (after index 70) in the bottom row charts.
### Interpretation
The data suggests that the Llama3.1-8B-Instruct model's attention mechanism is affected by the presence of meaningless tokens. The model appears to allocate less attention to tokens within the designated "Meaningless tokens" region, as shown in the bottom row charts. The top row charts indicate that the overall attention weights are generally lower when meaningless tokens are included, suggesting that the model distributes its attention differently in their presence.
The high attention weights observed for the initial tokens in the bottom row charts might indicate that the model focuses on the beginning of the input sequence before encountering the "Meaningless tokens." The subsequent increase in attention weights after the "Meaningless tokens" region could suggest that the model re-engages with the meaningful parts of the input.
Head 29's strong focus on a single token (index 22) when meaningless tokens are excluded could indicate that this head is particularly sensitive to specific features or patterns in the input that are masked or diluted by the presence of meaningless tokens.