## Line Chart: Attention Weight Comparison with and without Meaningless Tokens
### Overview
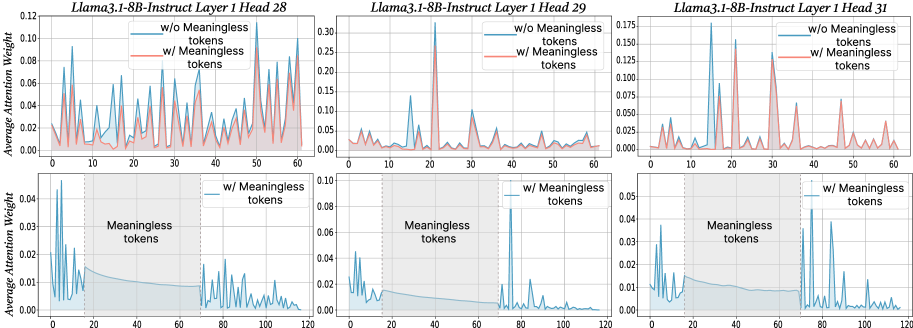
The image presents three line charts, arranged horizontally. Each chart compares the average attention weight for two conditions: "w/o Meaningless tokens" (without meaningless tokens) and "w/ Meaningless tokens" (with meaningless tokens). The charts correspond to different layers and heads of the Llama3.1-8B-Instruct model: Head 28, Head 29, and Head 31. Each chart has two subplots, one showing the attention weights up to x=60 and the other showing the attention weights up to x=120.
### Components/Axes
* **X-axis:** Represents the token position, ranging from 0 to 60 in the top subplots and 0 to 120 in the bottom subplots.
* **Y-axis:** Represents the Average Attention Weight, ranging from 0 to 0.12 in the first chart, 0 to 0.3 in the second chart, and 0 to 0.175 in the third chart.
* **Lines:** Two lines are plotted in each chart:
* Red line: "w/o Meaningless tokens"
* Cyan line: "w/ Meaningless tokens"
* **Title:** Each chart is titled with "Llama3.1-8B-Instruct Layer 1 Head [Number]".
* **Legend:** Located in the top-right corner of each chart, indicating the color correspondence for each condition.
### Detailed Analysis or Content Details
**Chart 1: Llama3.1-8B-Instruct Layer 1 Head 28**
* **Top Subplot (0-60):**
* The red line ("w/o Meaningless tokens") shows several sharp peaks, with maximum values around 0.10 at approximately x=20, x=40, and x=50. The line generally fluctuates between 0 and 0.10.
* The cyan line ("w/ Meaningless tokens") is relatively flat, hovering around 0.02-0.04 for most of the range, with a slight increase towards the end, reaching approximately 0.06 at x=60.
* **Bottom Subplot (0-120):**
* The cyan line ("w/ Meaningless tokens") remains relatively flat, fluctuating between 0.01 and 0.04.
**Chart 2: Llama3.1-8B-Instruct Layer 1 Head 29**
* **Top Subplot (0-60):**
* The red line ("w/o Meaningless tokens") exhibits several peaks, with maximum values around 0.25 at approximately x=10, x=30, and x=50. The line fluctuates significantly.
* The cyan line ("w/ Meaningless tokens") is generally lower, fluctuating between 0.02 and 0.10, with a peak around 0.10 at x=30.
* **Bottom Subplot (0-120):**
* The cyan line ("w/ Meaningless tokens") remains relatively flat, fluctuating between 0.01 and 0.07.
**Chart 3: Llama3.1-8B-Instruct Layer 1 Head 31**
* **Top Subplot (0-60):**
* The red line ("w/o Meaningless tokens") shows several peaks, with maximum values around 0.13 at approximately x=10, x=30, and x=50. The line fluctuates significantly.
* The cyan line ("w/ Meaningless tokens") is generally lower, fluctuating between 0.01 and 0.08, with a peak around 0.08 at x=30.
* **Bottom Subplot (0-120):**
* The cyan line ("w/ Meaningless tokens") remains relatively flat, fluctuating between 0.01 and 0.05.
### Key Observations
* In all three charts, the "w/o Meaningless tokens" (red line) consistently exhibits higher and more pronounced peaks in the top subplots compared to the "w/ Meaningless tokens" (cyan line).
* The "w/ Meaningless tokens" lines are generally much flatter, especially in the bottom subplots, indicating a more uniform distribution of attention weights.
* The magnitude of the attention weights varies across the different heads (28, 29, 31). Head 29 shows the highest overall attention weights.
* The bottom subplots show that the cyan lines remain relatively stable, suggesting that the addition of meaningless tokens doesn't significantly alter the attention distribution beyond the initial 60 tokens.
### Interpretation
The data suggests that the inclusion of "meaningless tokens" significantly alters the attention patterns within the Llama3.1-8B-Instruct model. Without meaningless tokens, the model focuses attention on specific tokens (as evidenced by the sharp peaks in the red lines), likely those most relevant to the task. The addition of meaningless tokens appears to diffuse the attention, resulting in a more uniform distribution (flatter cyan lines).
The higher attention weights observed in Head 29 might indicate that this head is particularly sensitive to the presence of meaningful information or is more prone to being influenced by the addition of meaningless tokens.
The difference between the top and bottom subplots suggests that the initial tokens (0-60) are more affected by the presence of meaningless tokens than the later tokens (60-120). This could be due to the model attempting to integrate the meaningless tokens into the context during the initial stages of processing.
The overall trend indicates that meaningless tokens reduce the model's ability to focus on the most important parts of the input sequence, potentially impacting its performance on downstream tasks. This is a critical observation for understanding the impact of data quality and preprocessing on the behavior of large language models.