## Line Graphs: Llama3.1-8B-Instruct Layer 1 Head Attention Weights with/without Meaningless Tokens
### Overview
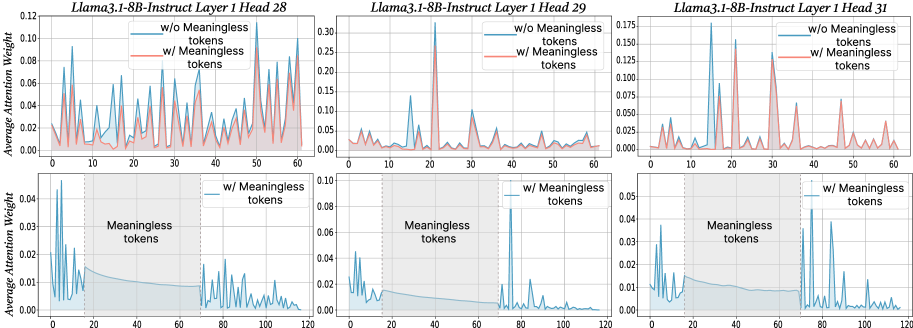
The image contains six line graphs comparing attention weights across three attention heads (28, 29, 31) in Layer 1 of the Llama3.1-8B-Instruct model. Each graph pair compares attention weights **with** (red) and **without** (blue) meaningless tokens. The x-axis represents token positions (0–120), and the y-axis shows average attention weight. Bottom subplots zoom into the 0–120 range with a shaded "Meaningless tokens" region (20–60).
---
### Components/Axes
- **X-axis**: Token Position (0–120)
- **Y-axis**: Average Attention Weight (0.00–0.12–0.175 depending on head)
- **Legends**:
- Blue: "w/o Meaningless tokens"
- Red: "w/ Meaningless tokens"
- **Subplot Structure**:
- Top subplots: Full 0–120 token range
- Bottom subplots: Zoomed 0–120 range with shaded 20–60 "Meaningless tokens" region
---
### Detailed Analysis
#### Head 28
- **Top Subplot**:
- Red line (w/ tokens) peaks at ~0.12 (token 10), ~0.08 (token 30), ~0.10 (token 50).
- Blue line (w/o tokens) peaks at ~0.06 (token 10), ~0.04 (token 30), ~0.05 (token 50).
- **Bottom Subplot**:
- Red line dominates 20–60 range (avg. ~0.08–0.10).
- Blue line drops sharply outside 20–60 (avg. ~0.01–0.03).
#### Head 29
- **Top Subplot**:
- Red line peaks at ~0.15 (token 20), ~0.10 (token 40).
- Blue line peaks at ~0.05 (token 20), ~0.03 (token 40).
- **Bottom Subplot**:
- Red line remains elevated in 20–60 (avg. ~0.06–0.08).
- Blue line flattens to ~0.02–0.04.
#### Head 31
- **Top Subplot**:
- Red line peaks at ~0.175 (token 10), ~0.12 (token 30), ~0.10 (token 50).
- Blue line peaks at ~0.07 (token 10), ~0.05 (token 30), ~0.04 (token 50).
- **Bottom Subplot**:
- Red line sustains high attention in 20–60 (avg. ~0.08–0.10).
- Blue line drops to ~0.01–0.03 outside 20–60.
---
### Key Observations
1. **Meaningless tokens amplify attention** in the 20–60 token range across all heads.
2. **Peaks in red lines** (w/ tokens) are consistently higher than blue lines (w/o tokens) in the shaded region.
3. **Blue lines** (w/o tokens) show reduced attention outside 20–60, suggesting meaningless tokens may anchor focus.
4. **Head 31** exhibits the highest overall attention weights, particularly in token 10 (w/ tokens: ~0.175).
---
### Interpretation
The data demonstrates that **meaningless tokens significantly increase attention weights** in the 20–60 token range, likely due to their salience or role in contextual framing. This suggests the model prioritizes these tokens when present, potentially improving task-specific performance (e.g., instruction following). The absence of meaningless tokens results in more dispersed attention, which may reduce efficiency. The consistent pattern across heads implies this behavior is a general property of the model’s attention mechanism, not head-specific.
**Notable Anomaly**: Head 31’s extreme peak at token 10 (w/ tokens: ~0.175) suggests an outlier in attention allocation, possibly indicating a unique processing role for that token position.